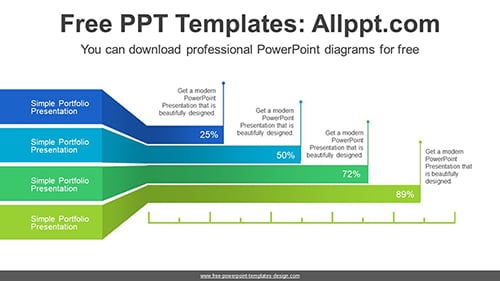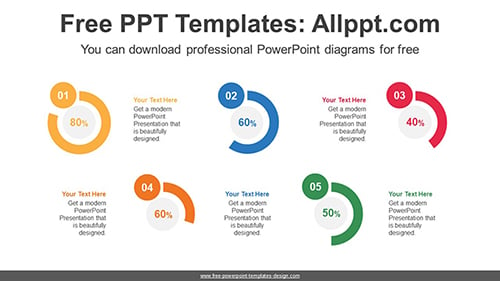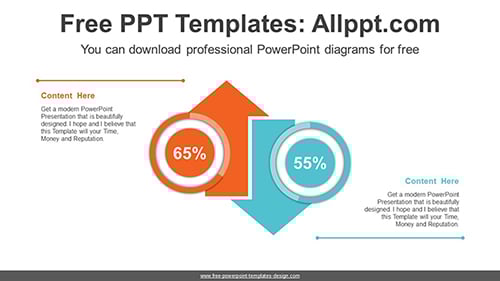
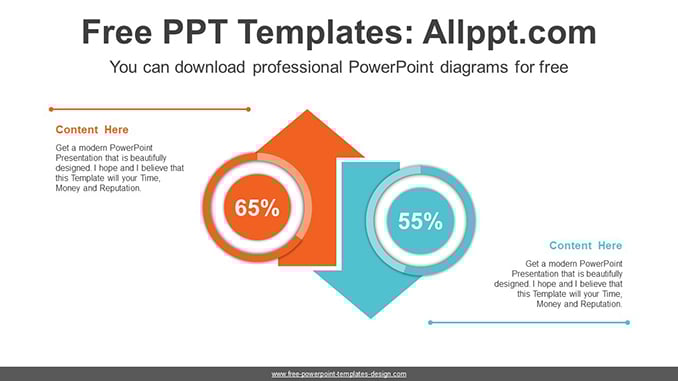
Up-Down Comparative Doughnut Charts PPT Diagram
These donut charts help you visualize comparisons, such as two variations, and growth rates. This makes it easy to describe your data with simple charts and text lists. You can also modify data with simple formula input.
Search Keywords: PowerPoint, diagram, template, presentation, graph, graphic, icons, infographic, information, idea, layout, data, design, process, progress, shape, step, symbol, concept, connection, creative, editable, analysis, analyze, audit, business, chart, element, management, part, report, research, result, statistics, stats, explains, compares, circle, circular, donuts, doughnut, compare, Up-Down, arrow
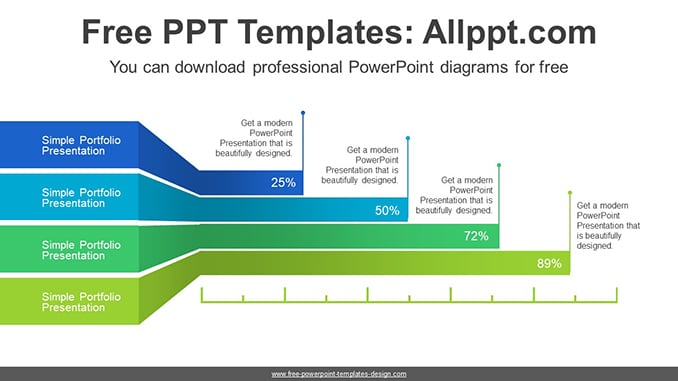
Up-Down Comparative Doughnut Charts PPT Diagram
This PowerPoint diagram template has theme color applied. So when you do simple copying and pasting, the color will be applied automatically. In addition, shapes and text are 100% editable
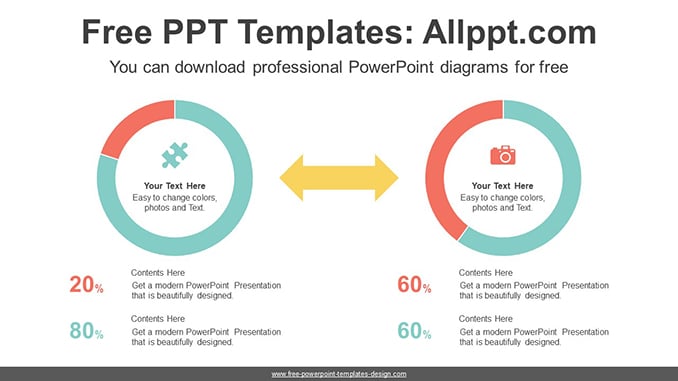
This ‘Up-Down Comparative Doughnut Charts PPT Diagram’ Preview:
This template can be used for school classes, business purposes, and commercial purposes. However, this template cannot be distributed absolutely.
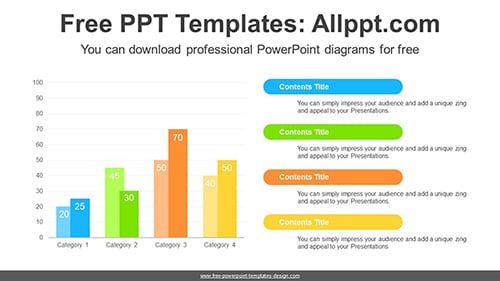
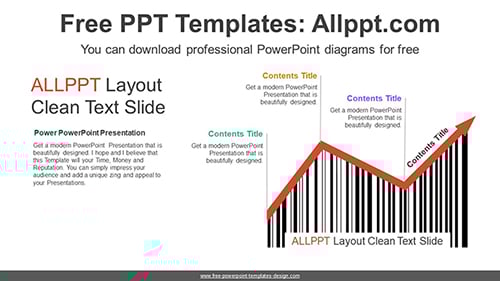
You May Also Like