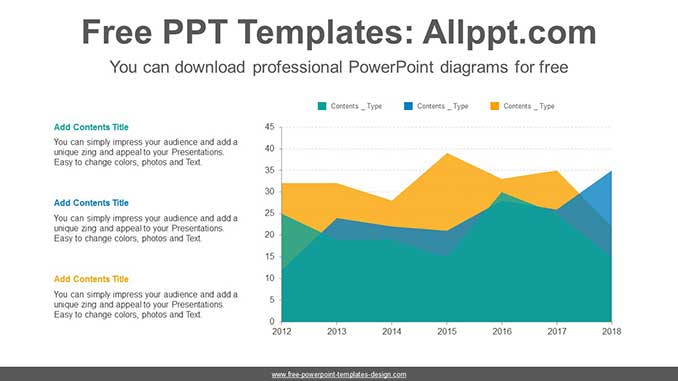
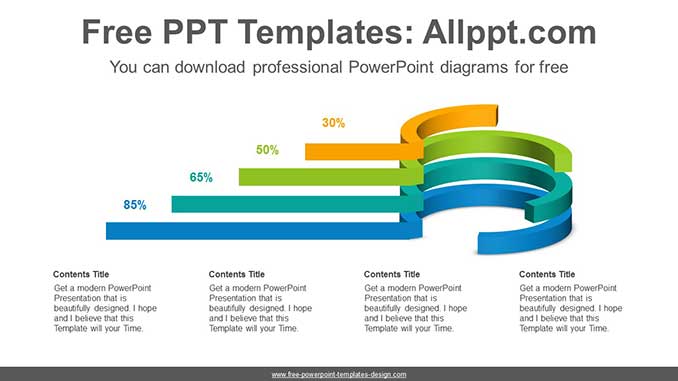
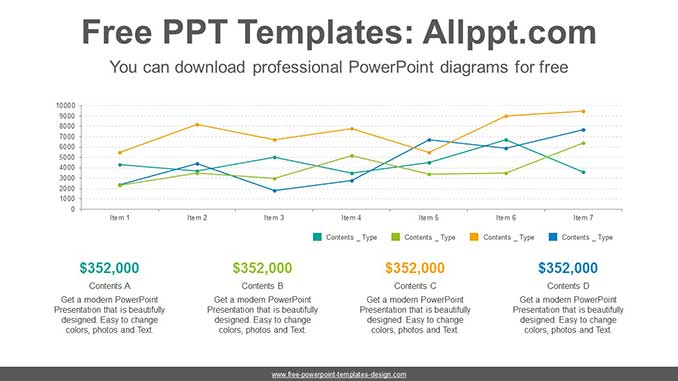
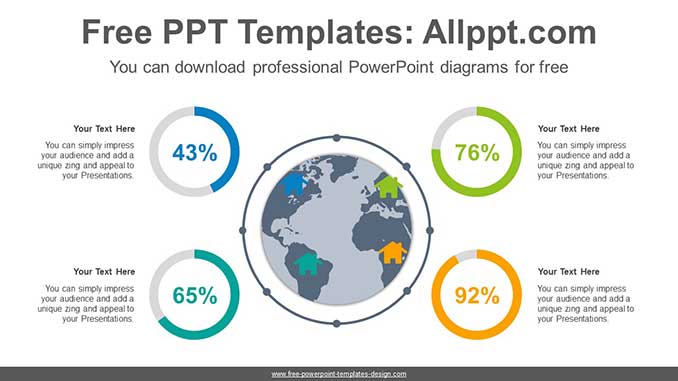
Posts

Table-line-chart-PowerPoint-Diagram-Template-list-image

Table line charts PowerPoint Diagram Template

Table line charts PowerPoint Diagram Template: This diagram is a line chart with table. This line chart helps you visualize changes, comparisons, growth rates and more. You can also modify data with simple formula input.

Search Keywords: PowerPoint, diagram, template, presentation, graph, graphic, icons, infographic, information, idea, layout, data, design, process, progress, shape, step, symbol, concept, connection, creative, editable, analysis, analyze, audit, business, chart, element, management, part, report, research, result, statistics, stats, line, table

Table line charts PowerPoint Diagram Template

This PowerPoint diagram template has theme color applied. So when you do simple copying and pasting, the color will be applied automatically. In addition, shapes and text are 100% editable

This ‘Table line charts PowerPoint Diagram Template’ Preview:

Table-line-chart-PowerPoint-Diagram-Template-post-image

This template can be used for school classes, business purposes, and commercial purposes. However, this template cannot be distributed absolutely.

You May Also Like

Laptop-clustered-bar-chart-PowerPoint-Diagram-Template-list-image

Laptop clustered bar chart PowerPoint Diagram Template

Laptop clustered bar chart PowerPoint Diagram Template: This diagram is a clustered bar graph that can be modified with simple formula inputs. A bar graph shows the differences between categories or trends over time using the length or height of its bars.

Search Keywords: PowerPoint, diagram, template, presentation, graph, graphic, icons, infographic, information, idea, layout, data, design, process, progress, shape, step, symbol, concept, connection, creative, editable, analysis, analyze, audit, business, chart, element, management, part, report, research, result, statistics, stats, clustered, bar, simple, laptop, rhombus, diamond

Laptop clustered bar chart PowerPoint Diagram Template

This PowerPoint diagram template has theme color applied. So when you do simple copying and pasting, the color will be applied automatically. In addition, shapes and text are 100% editable

This ‘Laptop clustered bar chart PowerPoint Diagram Template’ Preview:

Laptop-clustered-bar-chart-PowerPoint-Diagram-Template-post-image

This template can be used for school classes, business purposes, and commercial purposes. However, this template cannot be distributed absolutely.

You May Also Like

Economical-Stock-Market-PowerPoint-Templates-List

Economical Stock Market PowerPoint Templates

This template is based on the Stock Market. We designed a tablet to trade in the background of the city. You can make a variety of expressions using shapes and backgrounds included in the template. We always wish you a successful presentation.

Search Keywords: commerce, commercial, finance, tablet, stock, market, iPad, finances, stock, analyze, business, chart, buy, sell, communication, computer, concept, digital, display, economical, email, examining, finger, graph, hand, idea, information, internet, manager, market, marketing, media, mobile, mobility, person, phone, planning, pointing, review, screen, showing, smart, smartphone, solution, strategy, success, technology, touch, touching, touchscreen, using, wireless, woman, working, workplace, PowerPoint Templates, ppt, google slides

Economical Stock Market PowerPoint Templates: It includes 48 slides

Economical-Stock-Market-PowerPoint-Templates-Features
Features: Economical Stock Market PowerPoint Templates
  • Fully and easily editable (shape color, size, and text)
  • This template has a color theme and will automatically apply color when copied and pasted
  • It includes a customizable icon family with 135 different icons(Fully editable)
  • Drag and drop image placeholder
  • Easy editable data-driven charts (Editable via Excel)
  • Vector graphics 100% fully editable
  • Based on master slides
  • The aspect ratio of 16:9
  • All background images are included. But The pictures used for example in the image placeholder are not included (You can easily insert your images) => Example pictures copyright: pixabay.com
  • Our templates can be used for school classes, business purposes, and commercial purposes. But all images and graphics (shapes) in this template are produced by allppt.com. Redistribution of the template or the extraction graphics is completely prohibited.
Screenshots
Economical-Stock-Market-PowerPoint-Templates-preview-01
Economical-Stock-Market-PowerPoint-Templates-preview-02

Economical-Stock-Market-PowerPoint-Templates-preview-03

Economical-Stock-Market-PowerPoint-Templates-preview-04

You May Also Like

Numbering-doughnut-charts-PowerPoint-Diagram-Template-list-image

Numbering doughnut charts PowerPoint Diagram Template

Numbering doughnut charts PowerPoint Diagram Template: This is a design that lists four donut charts numbered. This makes it easy to describe the data with simple charts and text lists. Doughnut charts are easy to adjust numeric values with formula input.

Search Keywords: PowerPoint, diagram, template, presentation, graph, icons, infographic, information, idea, graphic, data, design, process, progress, shape, step, concept, connection, creative, connected, editable, analysis, analytics, analyze, audit, business, chart, circle, circular, donuts, doughnut, element, finance, graph, management, part, pie, report, research, result, round, statistics, stats, visualization, simple, compare, describe, Numbering

Numbering doughnut charts PowerPoint Diagram Template

This PowerPoint diagram template has theme color applied. So when you do simple copying and pasting, the color will be applied automatically. In addition, shapes and text are 100% editable

This ‘Numbering doughnut charts PowerPoint Diagram Template’ Preview:

Numbering-doughnut-charts-PowerPoint-Diagram-Template-post-image

This template can be used for school classes, business purposes, and commercial purposes. However, this template cannot be distributed absolutely.

You May Also Like

3D-pie-chart-PowerPoint-Diagram-Template-list-image

3D pie chart PowerPoint Diagram Template

3D pie chart PowerPoint Diagram Template: This 3D Pie Chart is data driven chart. A colorful charts has a visual effect. This pie chart can easily adjust numeric values with formula inputs.

Search Keywords: PowerPoint, diagram, template, presentation, graph, graphic, icons, infographic, information, idea, layout, data, design, process, progress, shape, step, symbol, concept, connection, creative, editable, analysis, analyze, audit, business, chart, element, management, part, report, research, result, statistics, stats, pie, circle, round, 3D

3D pie chart PowerPoint Diagram Template

This PowerPoint diagram template has theme color applied. So when you do simple copying and pasting, the color will be applied automatically. In addition, shapes and text are 100% editable

This ‘3D pie chart PowerPoint Diagram Template’ Preview:

3D-pie-chart-PowerPoint-Diagram-Template-postt-image

This template can be used for school classes, business purposes, and commercial purposes. However, this template cannot be distributed absolutely.

You May Also Like

Simple-line-chart-PowerPoint-Diagram-Template-list-image

Simple line chart PowerPoint Diagram Template

Simple line chart PowerPoint Diagram Template: This diagram is a line chart with list. This line chart helps you visualize changes, comparisons, growth rates, and more. You can also modify data with simple formula input.

Search Keywords: PowerPoint, diagram, template, presentation, graph, graphic, icons, infographic, information, idea, layout, data, design, process, progress, shape, step, symbol, concept, connection, creative, editable, analysis, analyze, audit, business, chart, element, management, part, report, research, result, statistics, stats, banner, line, changes, list, simple

Simple line chart PowerPoint Diagram Template

This PowerPoint diagram template has theme color applied. So when you do simple copying and pasting, the color will be applied automatically. In addition, shapes and text are 100% editable

This ‘Simple line chart PowerPoint Diagram Template’ Preview:

Simple-line-chart-PowerPoint-Diagram-Template-post-image

This template can be used for school classes, business purposes, and commercial purposes. However, this template cannot be distributed absolutely.

You May Also Like

Banner-doughnut-charts-PowerPoint-Diagram-Template-list-image

Banner doughnut charts PowerPoint Diagram Template

Banner doughnut charts PowerPoint Diagram Template: This diagram is a template for PowerPoint with 4 donut chart and banner. This makes it easy to describe the data with simple charts and text lists. Donuts charts are easy to adjust numeric values with formula input.

Search Keywords: PowerPoint, diagram, template, presentation, graph, icons, infographic, information, idea, graphic, data, design, process, progress, shape, step, concept, connection, creative, connected, editable, analysis, analyze, audit, business, chart, circle, donuts, element, management, part, pie, research, result, round, statistics, stats, simple, banner

Banner doughnut charts PowerPoint Diagram Template

This PowerPoint diagram template has theme color applied. So when you do simple copying and pasting, the color will be applied automatically. In addition, shapes and text are 100% editable

This ‘Banner doughnut charts PowerPoint Diagram Template’ Preview:

Banner-doughnut-charts-PowerPoint-Diagram-Template-post-image

This template can be used for school classes, business purposes, and commercial purposes. However, this template cannot be distributed absolutely.

You May Also Like

Rectangular-graph-PowerPoint-Diagram-Template-list-image

Rectangular graph PowerPoint Diagram Template

Rectangular graph PowerPoint Diagram Template: This diagram is a chart that lists the rectangles and displays the numbers as a color change. One bar represents 10%. It is also an editable graphic with text and icon placeholders.

Search Keywords: PowerPoint, diagram, template, presentation, graph, graphic, icons, infographic, information, idea, layout, data, design, process, progress, shape, step, symbol, concept, connection, creative, editable, analysis, analyze, audit, business, chart, element, management, part, report, research, result, statistics, stats, rectangle, business man, color change

Rectangular graph PowerPoint Diagram Template

This PowerPoint diagram template has theme color applied. So when you do simple copying and pasting, the color will be applied automatically. In addition, shapes and text are 100% editable

This ‘Rectangular graph PowerPoint Diagram Template’ Preview:

Rectangular-graph-PowerPoint-Diagram-Template-post-image

This template can be used for school classes, business purposes, and commercial purposes. However, this template cannot be distributed absolutely.

You May Also Like

Table-form-doughnut-charts-PowerPoint-Diagram-Template-list-image

Table-form doughnut charts PowerPoint Diagram Template

Table-form doughnut charts PowerPoint Diagram Template: This diagram is a template for PowerPoint with four table and doughnut charts. This makes it easy to describe the data with simple charts and text lists. Doughnut charts are easy to adjust numeric values with formula input.

Search Keywords: PowerPoint, diagram, template, presentation, graph, icons, infographic, information, idea, graphic, data, design, process, progress, shape, step, concept, connection, creative, connected, editable, analysis, analytics, analyze, audit, business, chart, circle, circular, donuts, doughnut, element, finance, graph, management, part, pie, report, research, result, round, statistics, stats, visualization, simple, table

Table-form doughnut charts PowerPoint Diagram Template

This PowerPoint diagram template has theme color applied. So when you do simple copying and pasting, the color will be applied automatically. In addition, shapes and text are 100% editable

This ‘Table-form doughnut charts PowerPoint Diagram Template’ Preview:

Table-form-doughnut-charts-PowerPoint-Diagram-Template-post-image

This template can be used for school classes, business purposes, and commercial purposes. However, this template cannot be distributed absolutely.

You May Also Like

Thermometer-chart-PowerPoint-Diagram-Template-list-image

Thermometer chart PowerPoint Diagram Template

Thermometer chart PowerPoint Diagram Template: This diagram is a bar graph thermometer chart. Data can be modified by simple numeric input. It is also an editable graphic with text and icon placeholders.

Search Keywords: PowerPoint, diagram, template, presentation, graph, graphic, icons, infographic, information, idea, layout, data, design, process, progress, shape, step, symbol, concept, connection, creative, editable, analysis, analyze, audit, business, chart, element, management, part, report, research, result, statistics, stats, column, thermometer, chart, bar

Thermometer chart PowerPoint Diagram Template

This PowerPoint diagram template has theme color applied. So when you do simple copying and pasting, the color will be applied automatically. In addition, shapes and text are 100% editable

This ‘Thermometer chart PowerPoint Diagram Template’ Preview:

Thermometer-chart-PowerPoint-Diagram-Template-post-image

This template can be used for school classes, business purposes, and commercial purposes. However, this template cannot be distributed absolutely.

You May Also Like