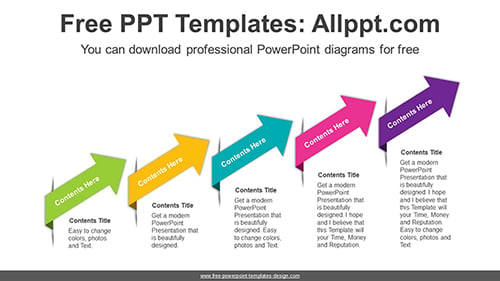
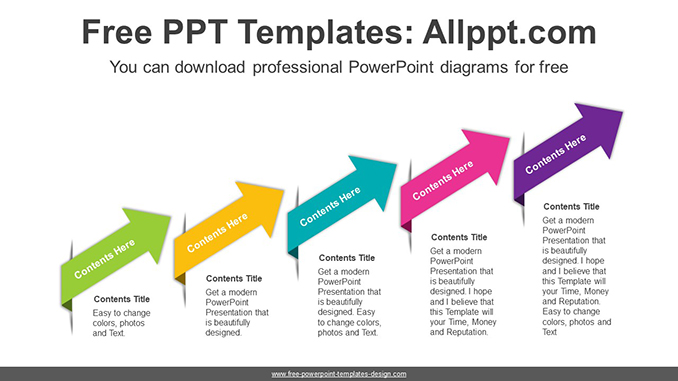
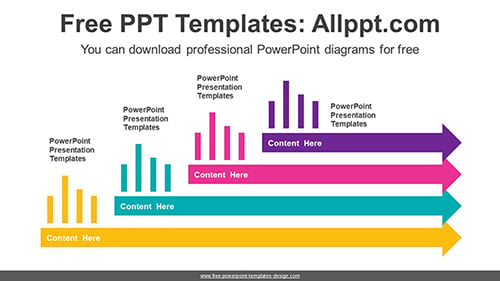
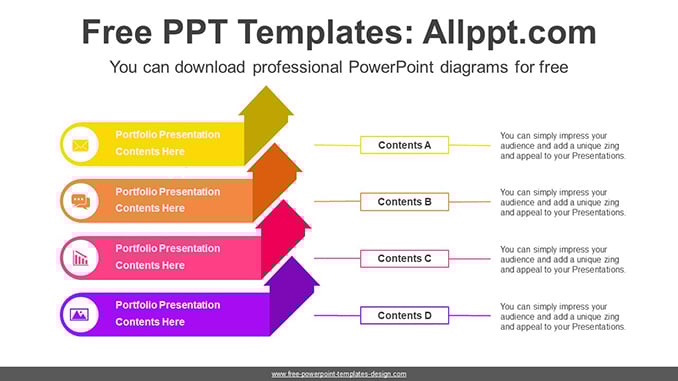
Right Angles Folded Ribbon PowerPoint Diagram
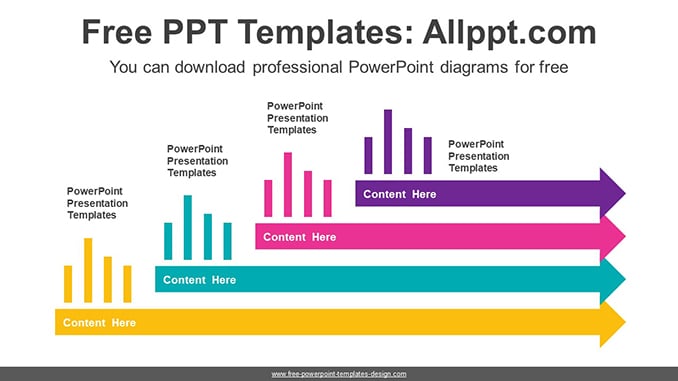
This template is a colorful ribbon arrow design folded at right angles. Rectangular folded ribbons gradually increase in size and height. It is also an editable graphic with text and icon placeholders.
Search Keywords: diagram, template, presentation, graph, graphic, icons, infographic, information, idea, layout, data, design, process, progress, shape, step, symbol, concept, connection, creative, editable, rise, staircase, stairs, up, growth, arrow, horizontal, stacked, rising, ribbon, folded, right angles
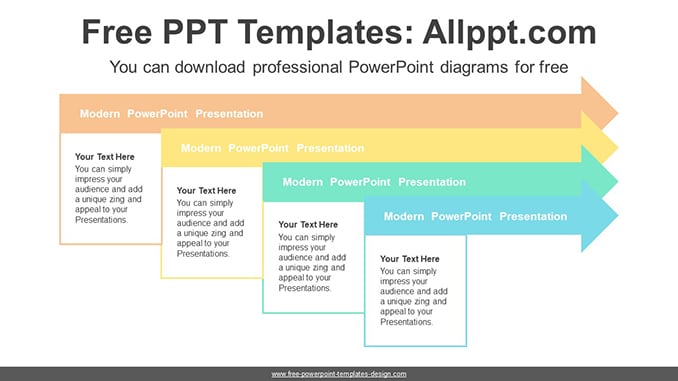
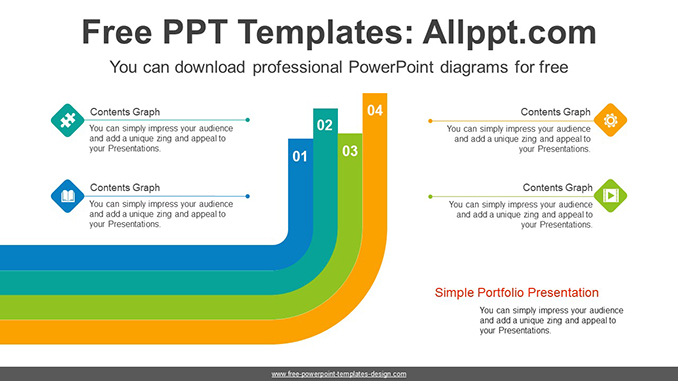
Right Angles Folded Ribbon PowerPoint Diagram
This PowerPoint diagram template has theme color applied. So when you do simple copying and pasting, the color will be applied automatically. In addition, shapes and text are 100% editable
This ‘Right Angles Folded Ribbon PowerPoint Diagram’ Preview:
This template can be used for school classes, business purposes, and commercial purposes. However, this template cannot be distributed absolutely.
You May Also Like