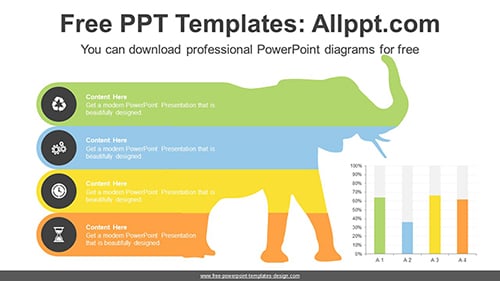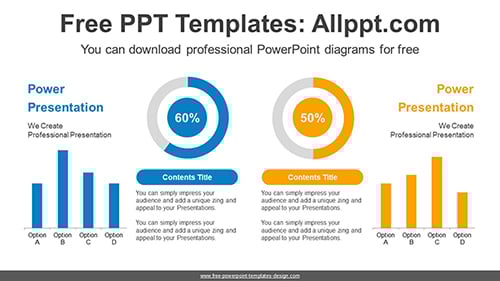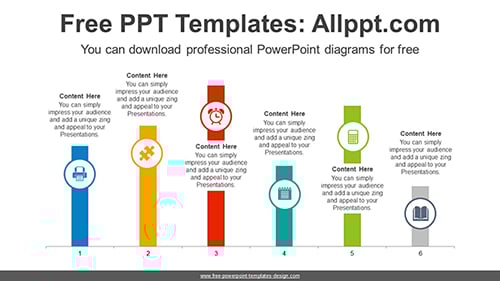
Vertical Column Chart PowerPoint Diagram
This diagram is a design in which a circle draws attention to a vertical bar chart. This is a concise chart that fills the space so the data can be easily explained. Bar charts allow you to easily adjust numeric values by entering formulas.
Search Keywords: template, presentation, graph, icons, infographic, information, idea, graphic, data, design, process, progress, shape, step, concept, connection, creative, connected, editable, analysis, analyze, audit, business, chart, element, management, part, report, research, result, statistics, stats, table, vertical, bar, vertical, column, circle
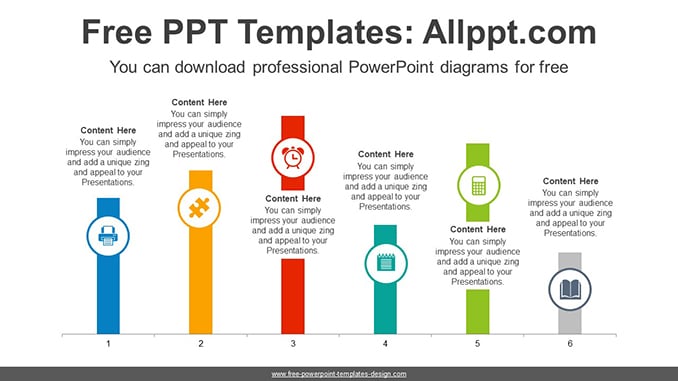
Vertical Column Chart PowerPoint Diagram
This PowerPoint diagram template has theme color applied. So when you do simple copying and pasting, the color will be applied automatically. In addition, shapes and text are 100% editable
This ‘Vertical Column Chart PowerPoint Diagram’ Preview:
This template can be used for school classes, business purposes, and commercial purposes. However, this template cannot be distributed absolutely.
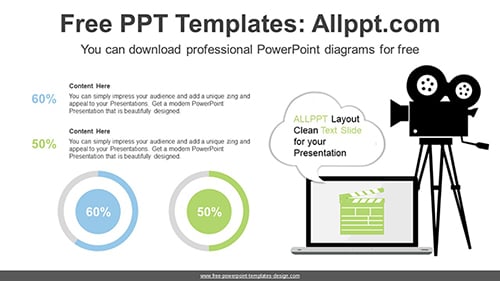
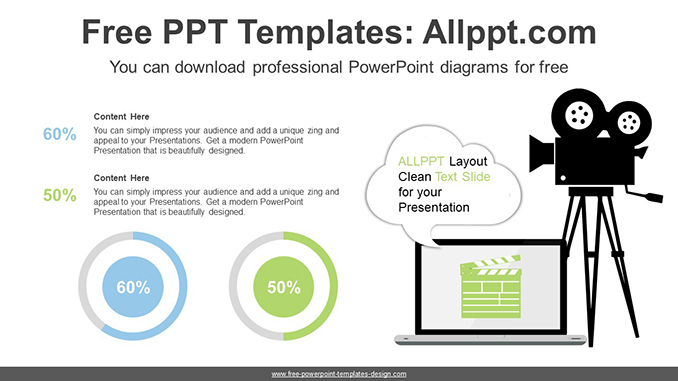
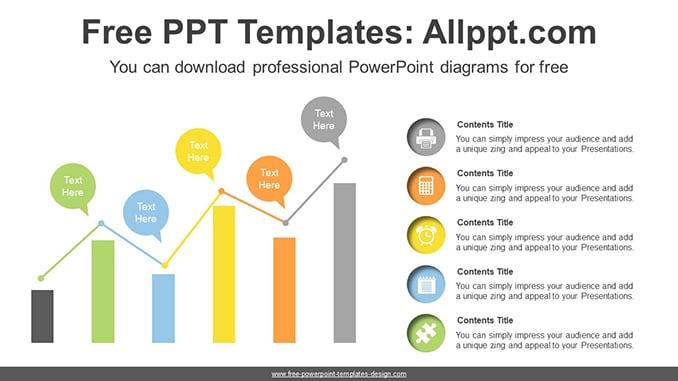
You May Also Like