Economical Stock Trading PowerPoint Templates
This template is designed for finance professionals, investors, and analysts seeking to visualize market trends and financial data. Featuring a futuristic digital background, this PowerPoint template symbolizes the power of data-driven decision-making. It is ideal for presentations on stock analysis, investment strategy, financial forecasting, fintech solutions, or economic growth.
Search Keywords: Finance, Investment, Stock, Growth, Strategy, Market, Data, Analysis, Economy, Trend, Forecast, Business, Digital, Fintech, Trading, Chart, Graph, Report, Presentation, Money, Planning, Profit, Risk, Return, Innovation, Professional, Corporate, Financial, Visual, Analytics, dividends, investment strategy, financial forecasting, fintech solutions, economic growth, PowerPoint Templates, ppt, google slides
Economical Stock Trading PowerPoint Templates: It includes 48 slides
Features: Economical Stock Trading PowerPoint Templates
- Fully and easily editable (shape color, size, and text)
- This template has a color theme and will automatically apply color when copied and pasted
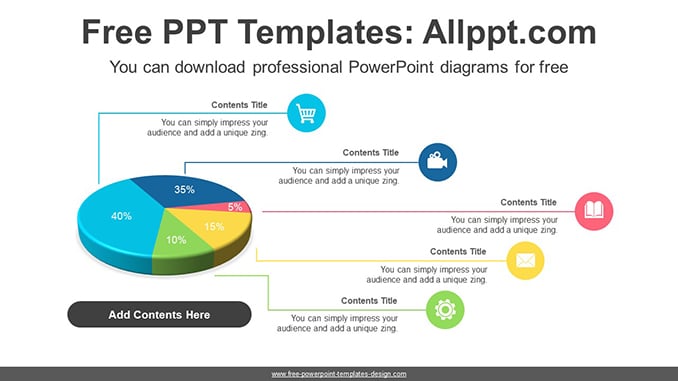
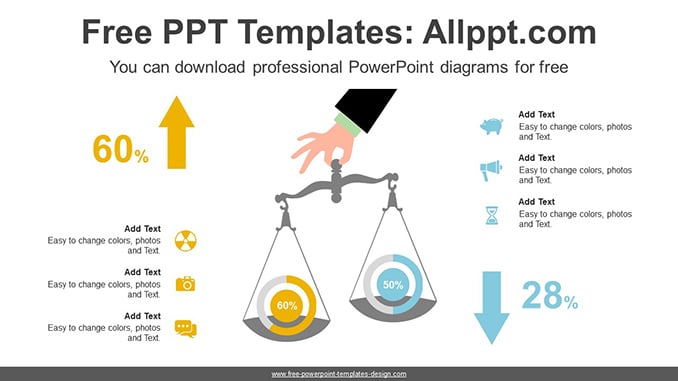
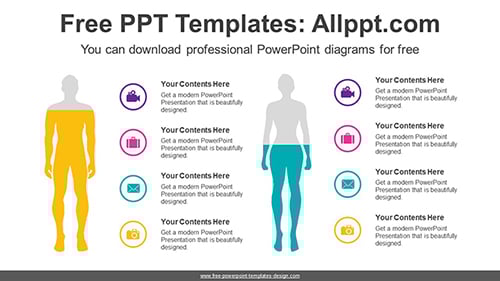
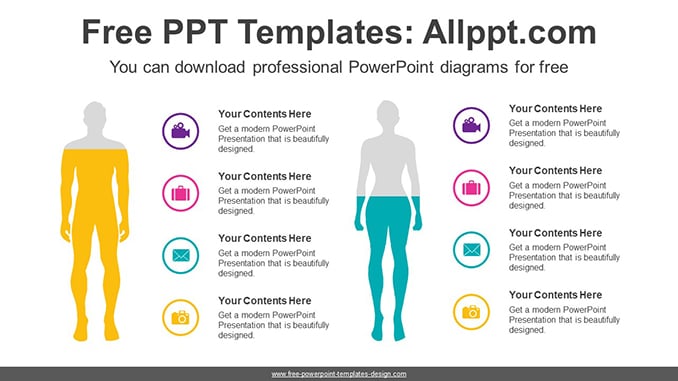
- It includes a customizable icon family with 135 different icons(Fully editable)
- Drag and drop image placeholder
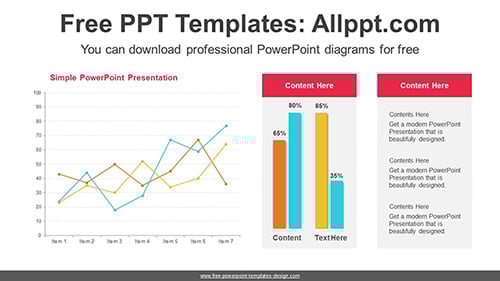
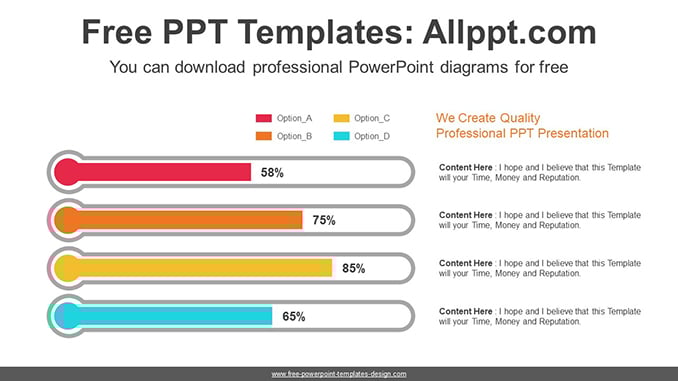
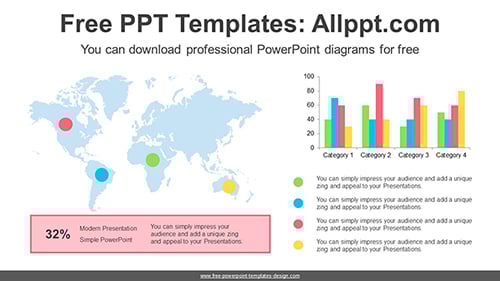
- Easy editable data-driven charts (Editable via Excel)
- Vector graphics 100% fully editable
- Based on master slides
- The aspect ratio of 16:9
- All background images are included. The images used are AI-generated images and images from pixabay.com that have been reprocessed to fit the background image. But The pictures used for example in the image placeholder are not included (You can easily insert your images) => Example pictures copyright: pixabay.com
- Our templates can be used for school classes, business purposes, and commercial purposes. But all images and graphics (shapes) in this template are produced by allppt.com. Redistribution of the template or the extraction graphics is completely prohibited.
Screenshots
You May Also Like