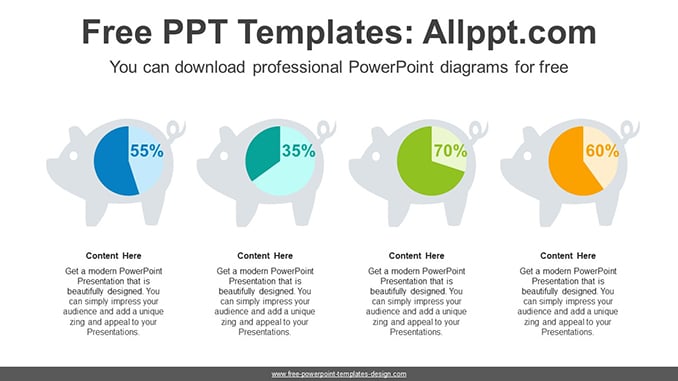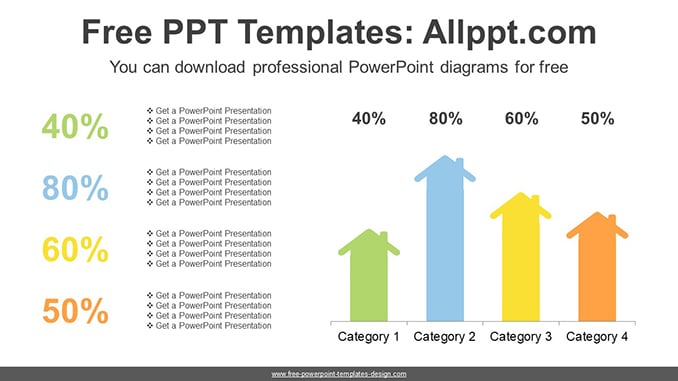
Human Body Percentage Diagram Template
This diagram is a set of 10 equal pieces of person models. One puzzle piece counts 10 percent of 100 cube combinations. You can display the desired value with the color change.
Search Keywords: template, presentation, graph, graphic, icons, infographic, information, design, shape, creative, editable, analysis, analyze, audit, business, chart, part, report, research, statistics, stats, body, human, percentage, puzzle, slice, piece, person
Human Body Percentage Diagram Template
This PowerPoint diagram template has theme color applied. So when you do simple copying and pasting, the color will be applied automatically. In addition, shapes and text are 100% editable
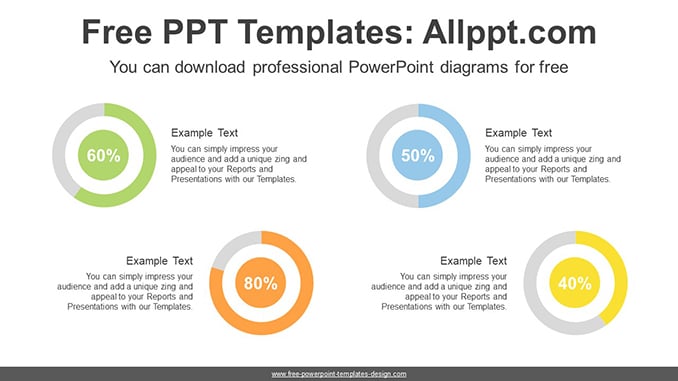
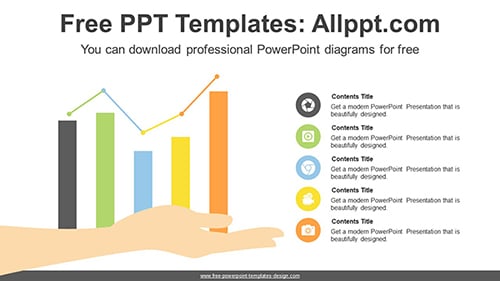
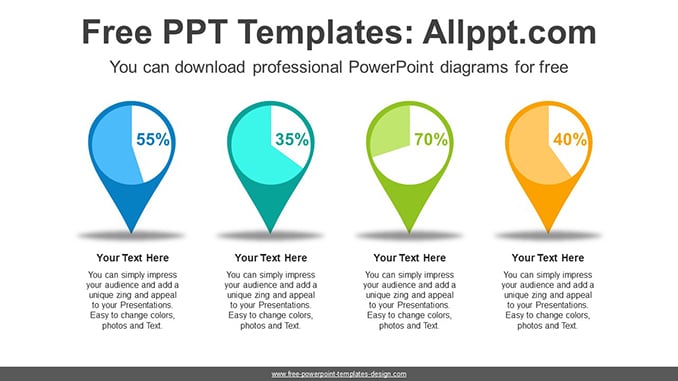
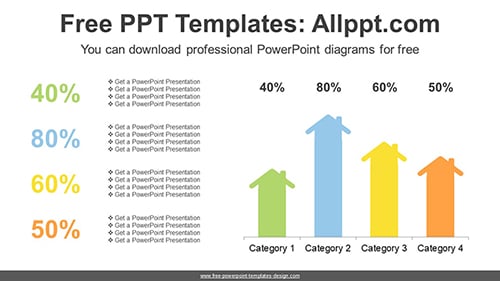
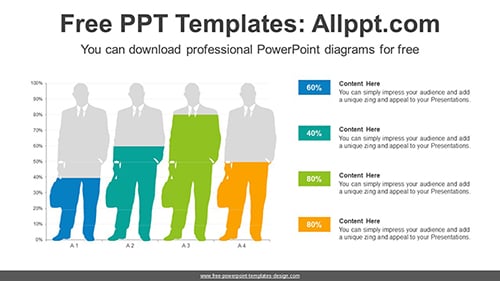
This ‘Human Body Percentage Diagram Template’ Preview:

This template can be used for school classes, business purposes, and commercial purposes. However, this template cannot be distributed absolutely.
You May Also Like