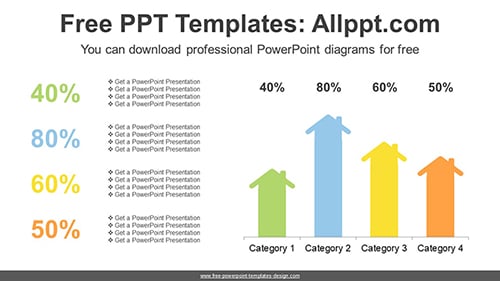
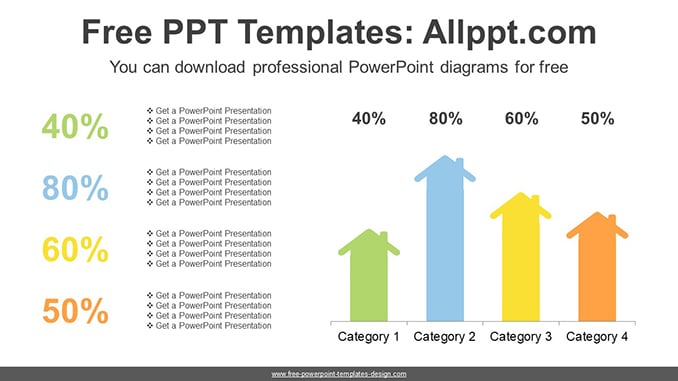
Real Estate Vertical Bar Chart PPT Diagram
This diagram is a house-shaped vertical bar chart. This is a great way to visually represent the rise and fall of real estate. Bar charts can easily adjust numeric values by entering formulas.
Search Keywords: template, presentation, graph, icons, infographic, information, idea, graphic, data, design, process, progress, shape, step, concept, connection, creative, connected, editable, analysis, analyze, audit, business, chart, element, management, part, report, research, result, statistics, stats, table, vertical, bar, house, real estate, vertical
Real Estate Vertical Bar Chart PPT Diagram
This PowerPoint diagram template has theme color applied. So when you do simple copying and pasting, the color will be applied automatically. In addition, shapes and text are 100% editable
This ‘Real Estate Vertical Bar Chart PPT Diagram’ Preview:
This template can be used for school classes, business purposes, and commercial purposes. However, this template cannot be distributed absolutely.
You May Also Like