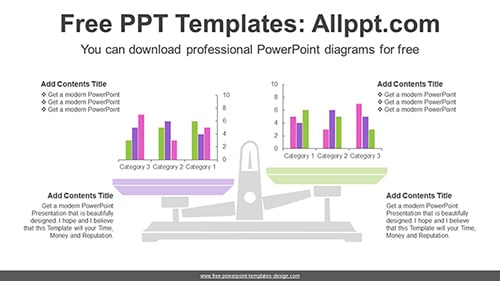
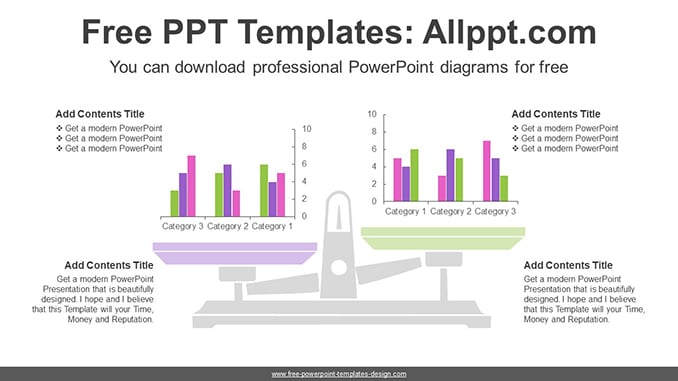
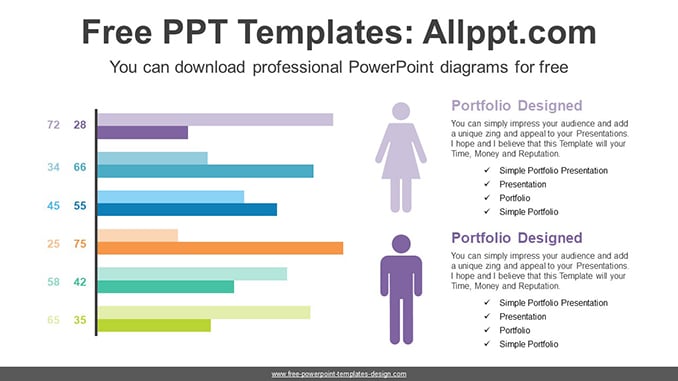
Clustered Bar Charts Diagram Template
This diagram is a horizontally clustered bar graph that you can modify with simple formula input. The bar graph can be used to visualize the numerical value you want to display using the length or height of the bar.
Search Keywords: PowerPoint, diagram, template, presentation, graph, graphic, icons, infographic, information, idea, layout, data, design, process, progress, shape, step, symbol, concept, connection, creative, editable, analysis, analyze, audit, business, chart, element, management, part, report, research, result, statistics, stats, clustered, bar, simple, man, woman, female, male, comparison
Clustered Bar Charts Diagram Template
This PowerPoint diagram template has theme color applied. So when you do simple copying and pasting, the color will be applied automatically. In addition, shapes and text are 100% editable
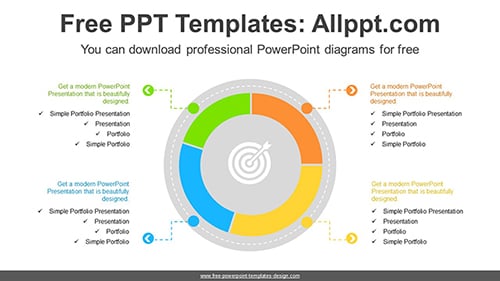
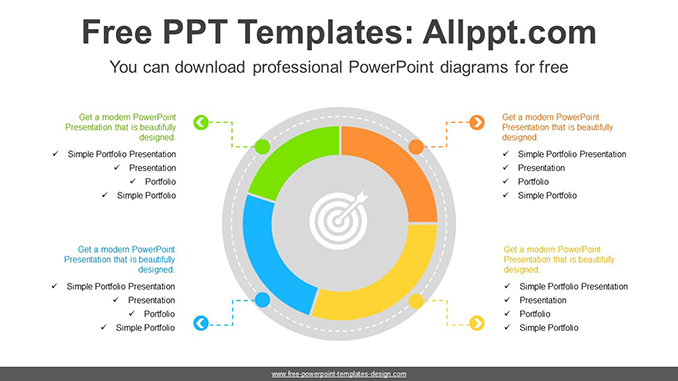
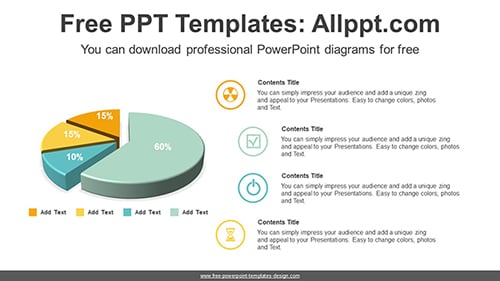
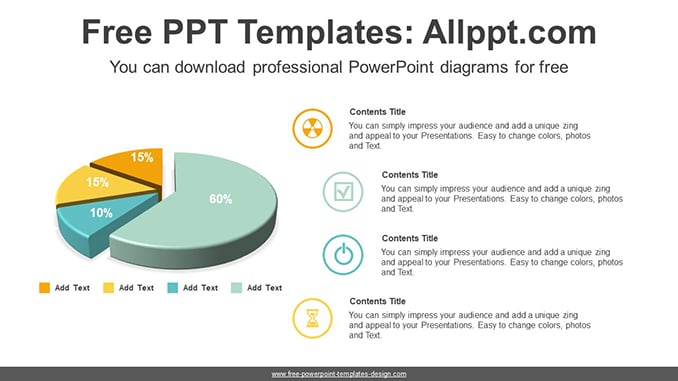
This ‘Clustered Bar Charts Diagram Template’ Preview:
This template can be used for school classes, business purposes, and commercial purposes. However, this template cannot be distributed absolutely.
You May Also Like