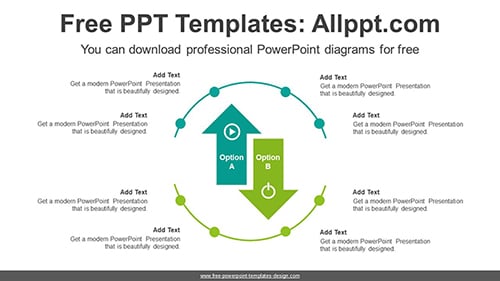
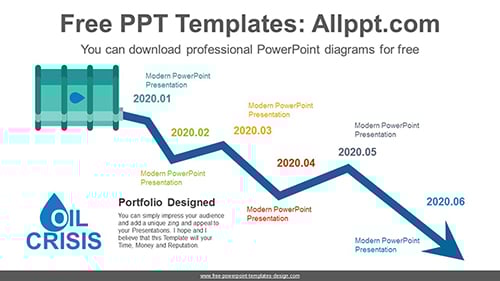
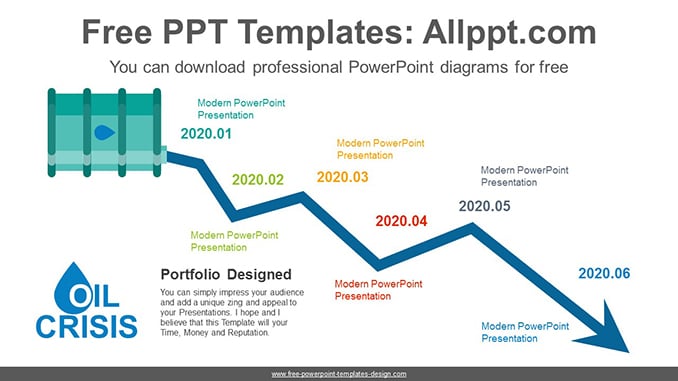
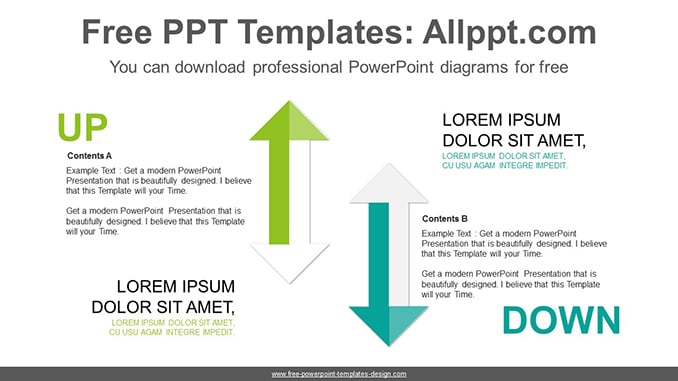
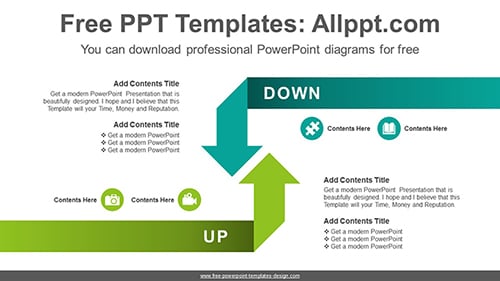
Two Diagonal Arrow PowerPoint Diagram
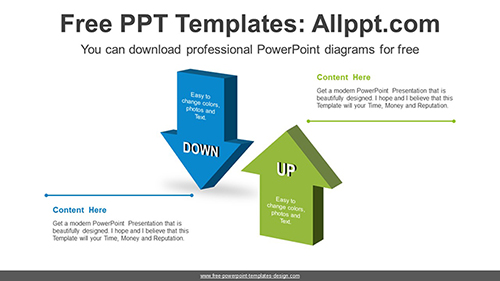
This diagram is an arrow design opposite to the top and bottom around the text box. This explains the increase and decrease of the arrows wrapped around the rectangle banner. It is also an editable graphic with text and icon placeholders.
Search Keywords: diagram, template, presentation, graph, icons, infographic, information, idea, illustration, layout, graph, graphic, graphics, data, design, process, progress, set, shape, step, banner, success, symbol, technology, sign, concept, connection, creative, planning, connected, editable, arrow, contrast, compare, opposite, two, up, down, reverse, facing, arrow, ribbon, diagonal, text box
Two Diagonal Arrow PowerPoint Diagram
This PowerPoint diagram template has theme color applied. So when you do simple copying and pasting, the color will be applied automatically. In addition, shapes and text are 100% editable
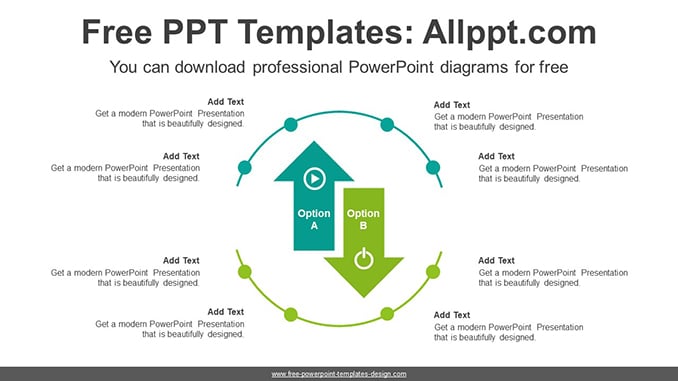
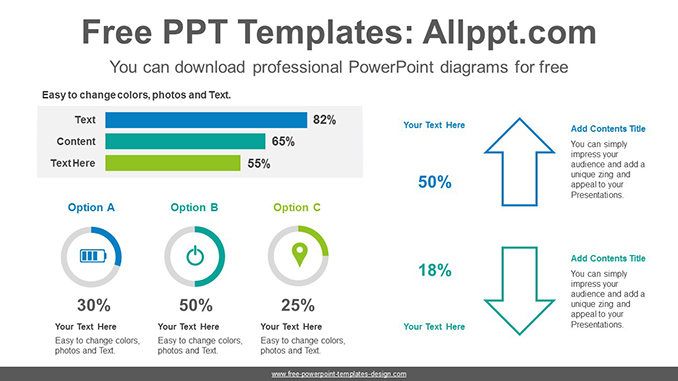
This ‘Two Diagonal Arrow PowerPoint Diagram’ Preview:
![]()
This template can be used for school classes, business purposes, and commercial purposes. However, this template cannot be distributed absolutely.
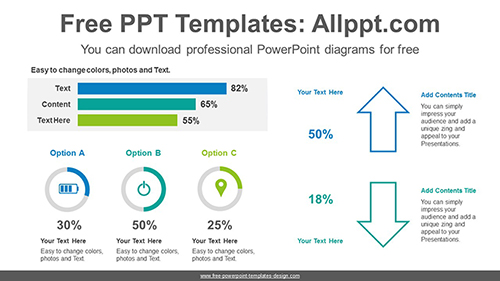
You May Also Like