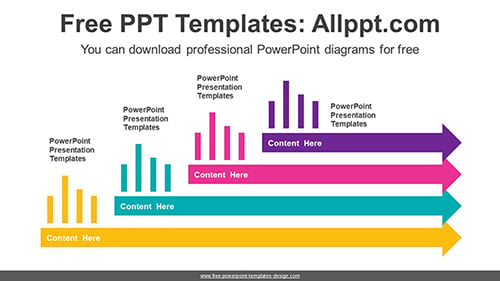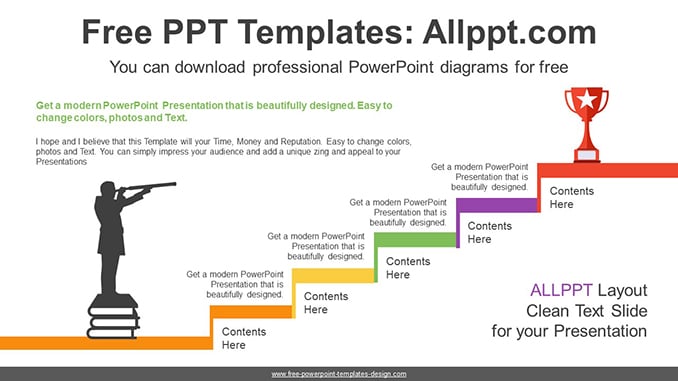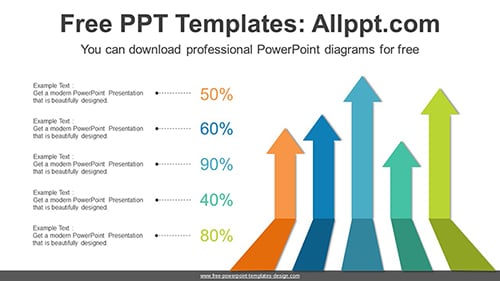
Rising Ribbon Arrows Bar Chart PPT Diagram
This diagram is a ribbon arrow bar chart design that rises from bottom to top. This chart type lets you add a layer of data to your visual analysis. This allows you to modify the data with simple numeric adjustments.
Search Keywords: PowerPoint, diagram, template, presentation, graph, graphic, icons, infographic, information, idea, layout, data, design, process, progress, shape, step, symbol, concept, connection, creative, editable, analysis, analyze, audit, business, chart, element, management, part, report, research, result, statistics, stats, explains, compares, ribbon, bar, rising, bent, top, bottom, arrow
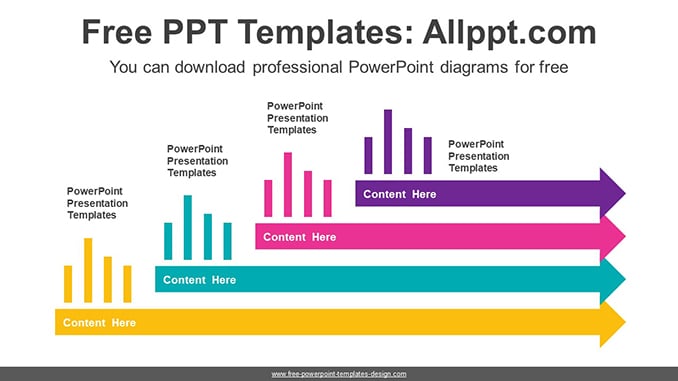
Rising Ribbon Arrows Bar Chart PPT Diagram
This PowerPoint diagram template has theme color applied. So when you do simple copying and pasting, the color will be applied automatically. In addition, shapes and text are 100% editable
This ‘Rising Ribbon Arrows Bar Chart PPT Diagram’ Preview:

This template can be used for school classes, business purposes, and commercial purposes. However, this template cannot be distributed absolutely.
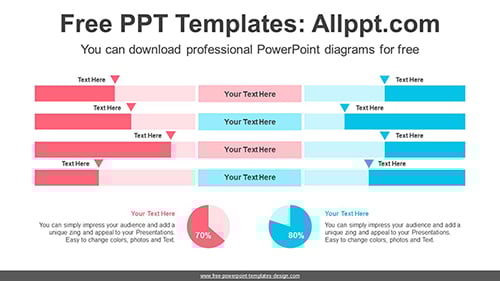
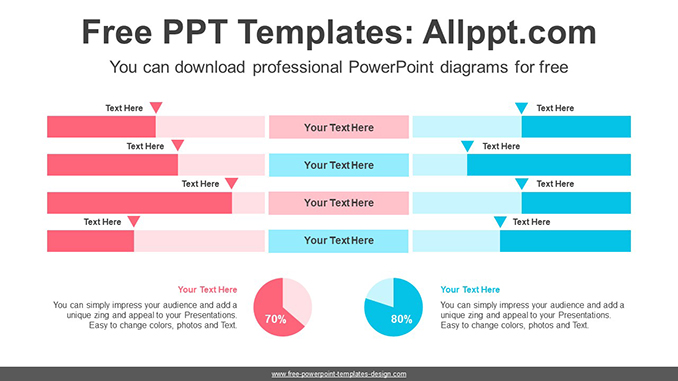
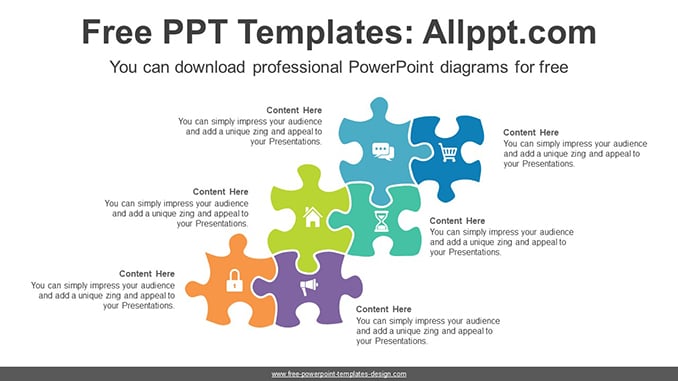
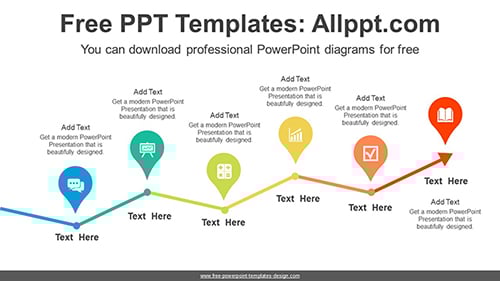
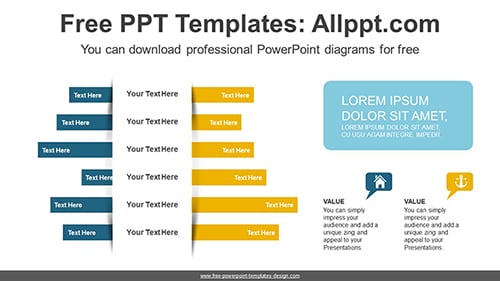
You May Also Like