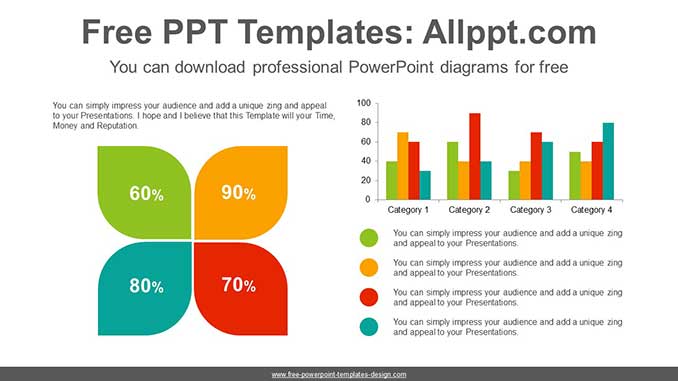
Clustered Bar Chart PowerPoint Diagram
This diagram is a clustered bar graph. This shows the differences between categories or trends over time.
Search Keywords:template, presentation, graph, graphic, icons, infographic, information, idea, layout, data, design, process, progress, shape, step, symbol, concept, connection, creative, editable, analysis, analyze, audit, business, chart, element, management, part, report, research, result, statistics, stats, clustered, bar, simple, Petals, leaves, flowers
Clustered Bar Chart PowerPoint Diagram
This PowerPoint diagram template has theme color applied. So when you do simple copying and pasting, the color will be applied automatically. In addition, shapes and text are 100% editable
This ‘Clustered Bar Chart PowerPoint Diagram’ Preview:
This template can be used for school classes, business purposes, and commercial purposes. However, this template cannot be distributed absolutely.
You May Also Like