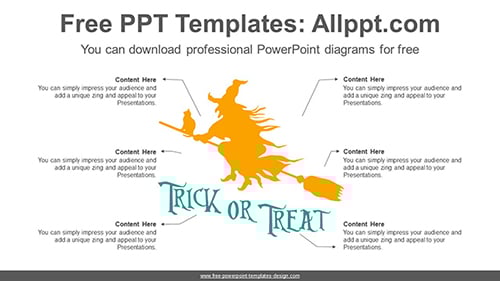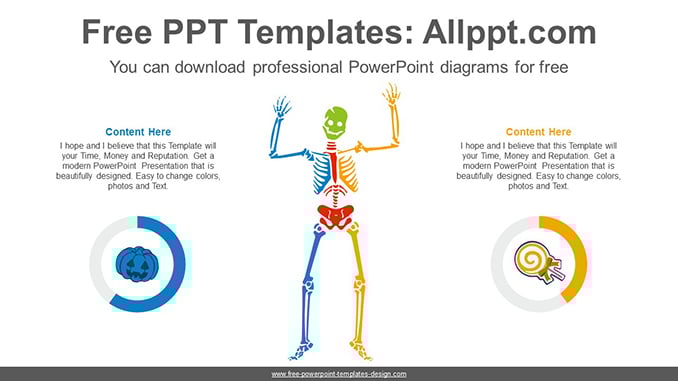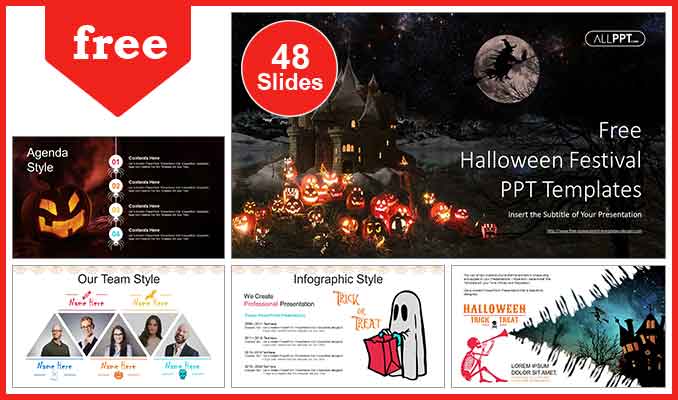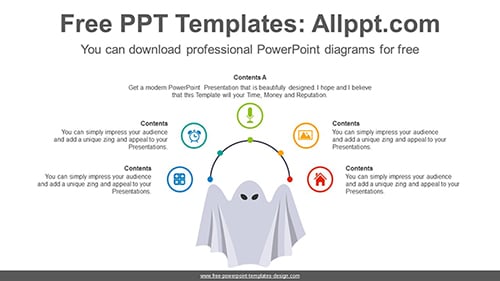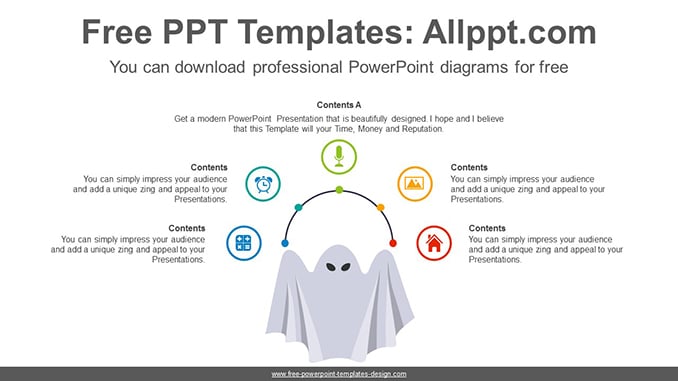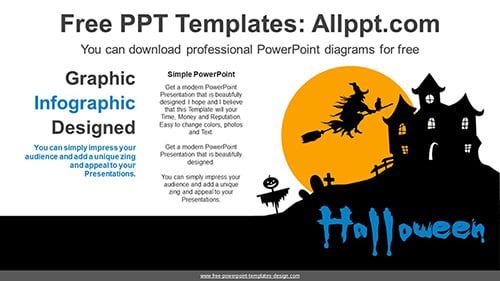
Halloween Witch PowerPoint Diagram
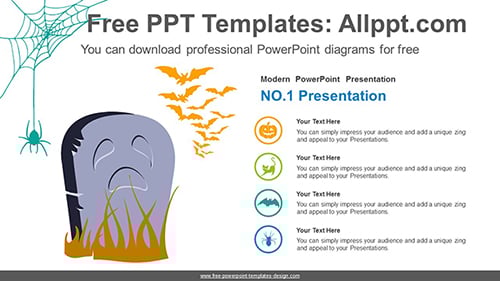
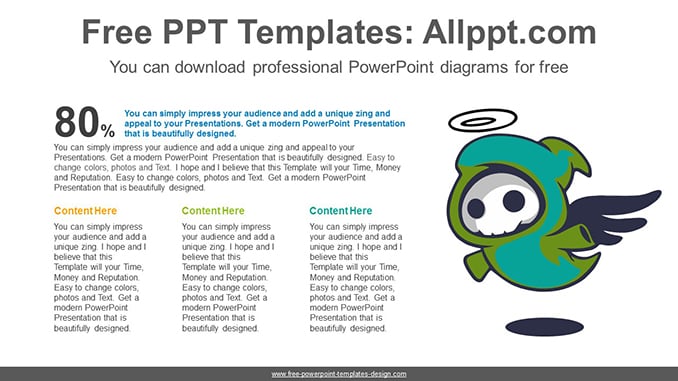
This diagram is a design of a witch flying on a full moon night. This explains the concept of Halloween with a witch’s castle. It is also an editable graphic with text and icon placeholders.
Search Keywords: Diagram, template, presentation, graph, graphic, icons, infographic, information, idea, layout, data, design, process, progress, shape, step, symbol, concept, connection, creative, editable, silhouette, illustration, Halloween, castle, full moon, night, witch, broom, pumpkin, ghost, cross
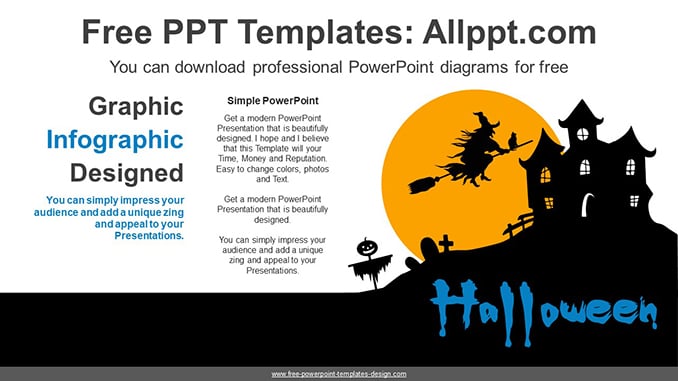
Halloween Witch PowerPoint Diagram
This PowerPoint diagram template has theme color applied. So when you do simple copying and pasting, the color will be applied automatically. In addition, shapes and text are 100% editable
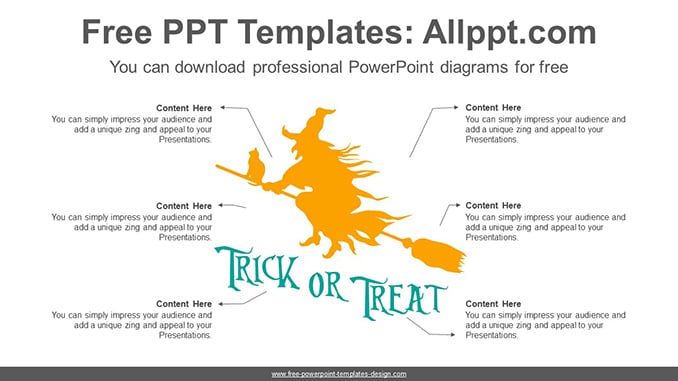
This ‘Halloween Witch PowerPoint Diagram’ Preview:
This template can be used for school classes, business purposes, and commercial purposes. However, this template cannot be distributed absolutely.
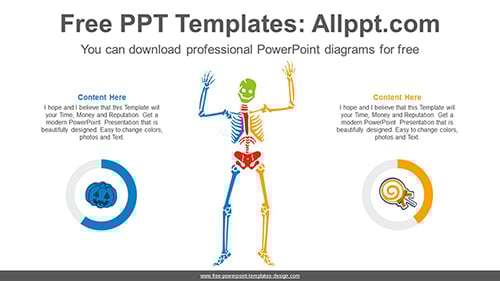
You May Also Like