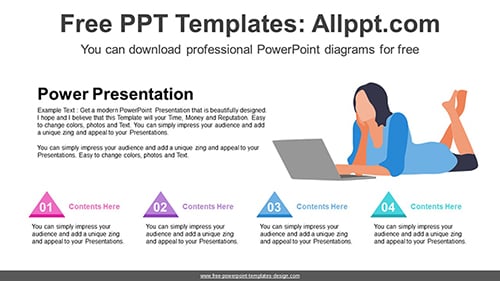
Laptop Working Woman PowerPoint Diagram
This diagram is an illustration of a woman lying down and comfortable working with a laptop. This can explain concepts such as working from home, computer work, and online learning. It is also an editable graphic with text and icon placeholders.
Search Keywords: PowerPoint, Diagram, template, presentation, graph, graphic, icons, infographic, information, idea, layout, data, design, process, progress, shape, step, symbol, concept, connection, creative, editable, illustration, online, learning, education, internet, computer, work, working from home, business, laptop, female
Laptop Working Woman PowerPoint Diagram
This PowerPoint diagram template has theme color applied. So when you do simple copying and pasting, the color will be applied automatically. In addition, shapes and text are 100% editable
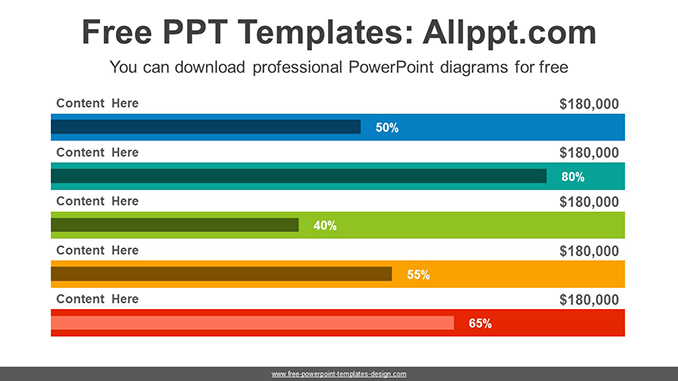
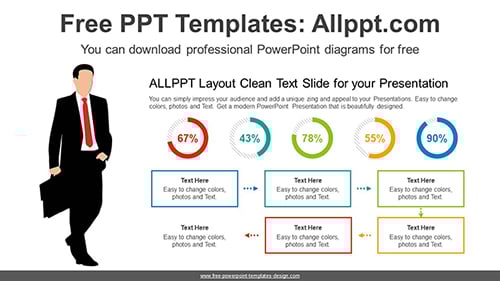
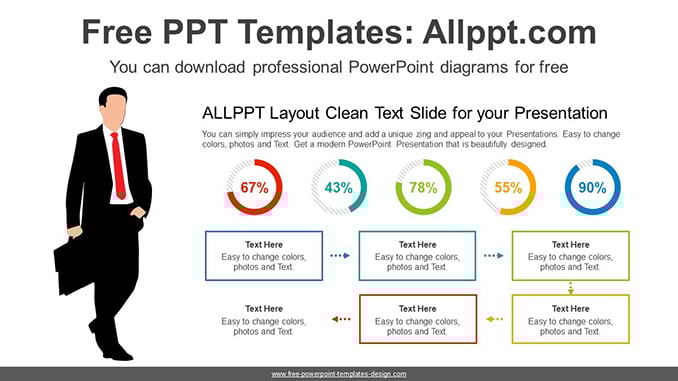
This ‘Laptop Working Woman PowerPoint Diagram’ Preview:

This template can be used for school classes, business purposes, and commercial purposes. However, this template cannot be distributed absolutely.
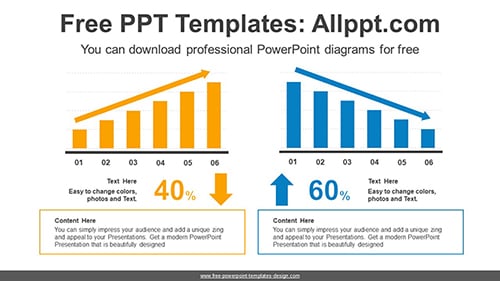
You May Also Like