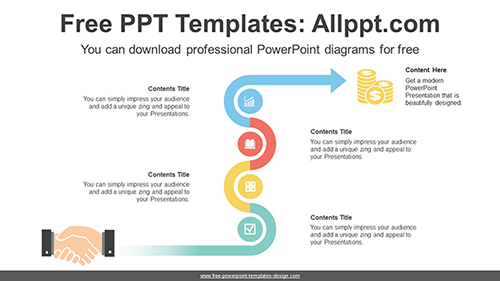
Area Chart PowerPoint Diagram
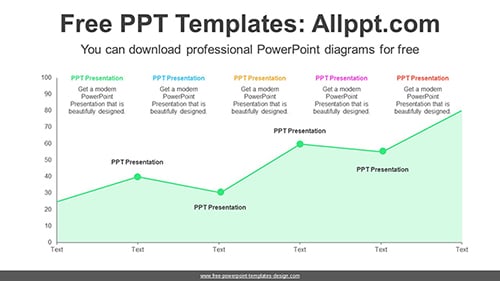
When the differences between data values are large, an area chart may make the data easier to understand. Area Chart allows you to easily adjust numeric values by entering formulas.
Search Keywords:diagram, template, presentation, graph, graphic, icons, infographic, information, idea, layout, data, design, process, progress, shape, step, symbol, concept, connection, creative, editable, analysis, analyze, audit, business, chart, element, management, part, report, research, result, statistics, stats, banner, line, changes, list, simple, area
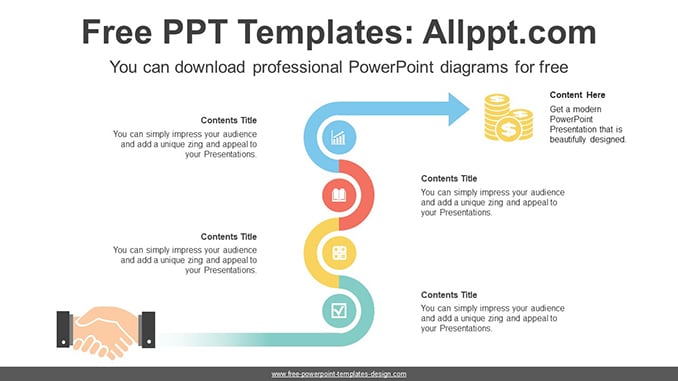
Area Chart PowerPoint Diagram
This PowerPoint diagram template has theme color applied. So when you do simple copying and pasting, the color will be applied automatically. In addition, shapes and text are 100% editable
This ‘Area Chart PowerPoint Diagram’ Preview:

This template can be used for school classes, business purposes, and commercial purposes. However, this template cannot be distributed absolutely.
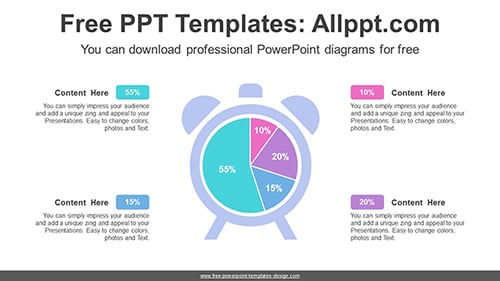
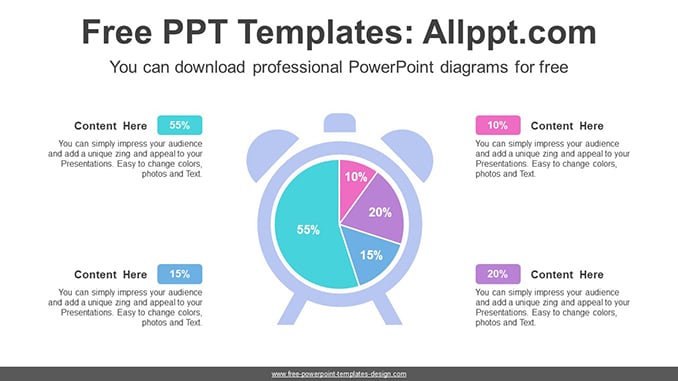
You May Also Like