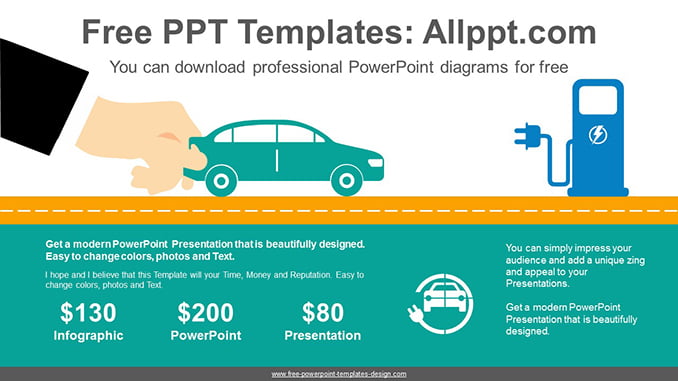
Electric Car Charging Station PowerPoint Diagram
This diagram is an illustration of an electric vehicle running towards an electric vehicle charging station. This is a good explanation for electric vehicles. It’s also an editable graphic with text and icon placeholders.
Search Keywords: Diagram, template, presentation, graph, graphic, icons, infographic, information, idea, layout, data, design, process, progress, shape, step, symbol, concept, connection, creative, editable, agenda, list, cross, banner, Electric Car, Charging Station, electric vehicle, Environment, pollution, protection, fuel, electricity, saving, hand, business, Eco, illustration
Electric Car Charging Station PowerPoint Diagram
This PowerPoint diagram template has theme color applied. So when you do simple copying and pasting, the color will be applied automatically. In addition, shapes and text are 100% editable
This ‘Electric Car Charging Station PowerPoint Diagram’ Preview:
This template can be used for school classes, business purposes, and commercial purposes. However, this template cannot be distributed absolutely.
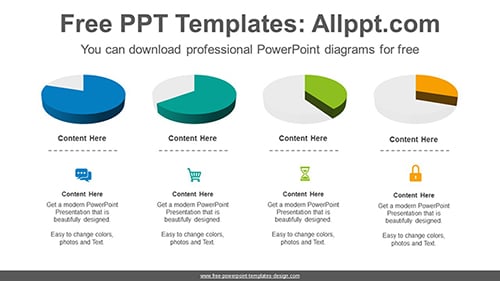
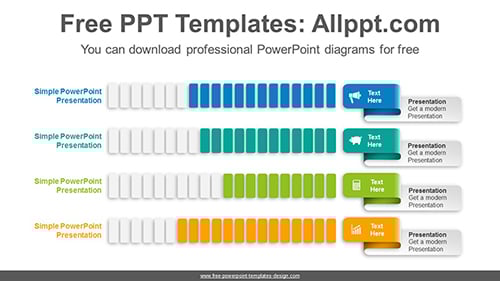
You May Also Like