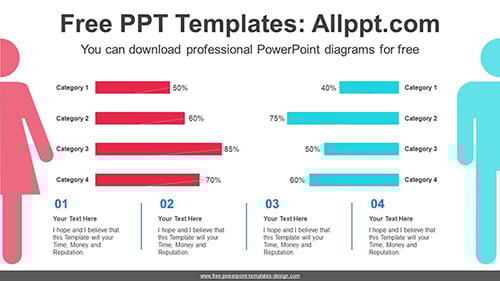
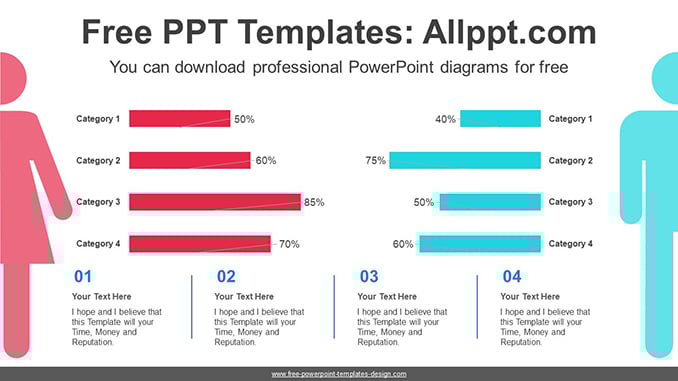
Comparison Bar Chart PowerPoint Diagram
This diagram is a bar chart showing the ratio of men to women in the data. This bar chart helps you visualize comparisons such as two variants and their growth rates. This chart can easily adjust numeric values with formula inputs.
Search Keywords: PowerPoint, diagram, template, presentation, graph, graphic, icons, infographic, information, idea, layout, data, design, process, progress, shape, step, symbol, concept, connection, creative, editable, analysis, analyze, audit, business, chart, element, management, part, report, research, result, statistics, stats, bar, man, male, woman, female, proportion
Comparison Bar Chart PowerPoint Diagram
This PowerPoint diagram template has theme color applied. So when you do simple copying and pasting, the color will be applied automatically. In addition, shapes and text are 100% editable
This ‘Comparison Bar Chart PowerPoint Diagram’ Preview:
This template can be used for school classes, business purposes, and commercial purposes. However, this template cannot be distributed absolutely.
You May Also Like