Half Sized Blog Element (Single Author Style)
Half Sized Blog Element (Multi Author Style)

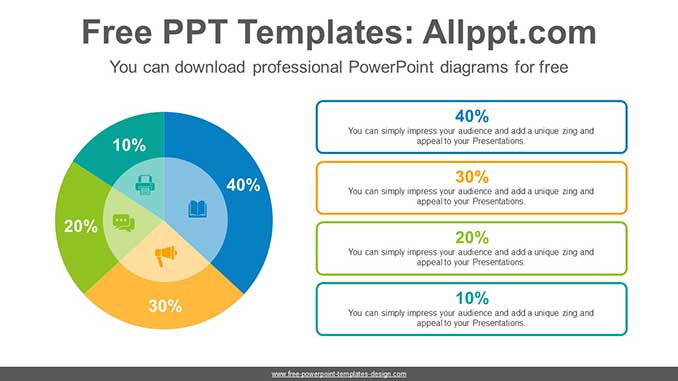
5-split pie chart PowerPoint Diagram
This diagram is a pie chart that shows the data divided into five parts. A colorful charts has a visual effect. It is also an editable graphic for text, charts, and icon placeholders. pie charts are easy to adjust numeric values with formula input. Search Keywords: template, presentation, graph, graphic, icons, idea, layout, data, design, […]
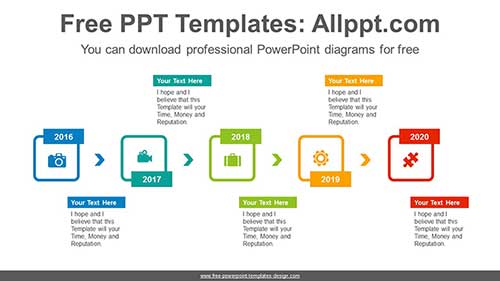
Color Square PowerPoint Diagram
This diagram shows the time flow by aligning the color line squares horizontally. Use it to emphasize the movement or direction of a timeline or workflow. It is also an editable graphic with text and icon placeholders. Search Keywords: template, presentation, graph, graphic, icons, infographic, information, idea, layout, data, design, process, progress, shape, step, symbol, […]
 /p>
/p>
5-split pie chart PowerPoint Diagram
/0 Comments/in Powerpoint Charts, PPT Charts /by adminaeThis diagram is a pie chart that shows the data divided into five parts. A colorful charts has a visual effect. It is also an editable graphic for text, charts, and icon placeholders. pie charts are easy to adjust numeric values with formula input. Search Keywords: template, presentation, graph, graphic, icons, idea, layout, data, design, […]
Color Square PowerPoint Diagram
/3 Comments/in PPT Diagrams, Timeline Diagrams /by adminaeThis diagram shows the time flow by aligning the color line squares horizontally. Use it to emphasize the movement or direction of a timeline or workflow. It is also an editable graphic with text and icon placeholders. Search Keywords: template, presentation, graph, graphic, icons, infographic, information, idea, layout, data, design, process, progress, shape, step, symbol, […]