Half Sized Blog Element (Single Author Style)
Half Sized Blog Element (Multi Author Style)
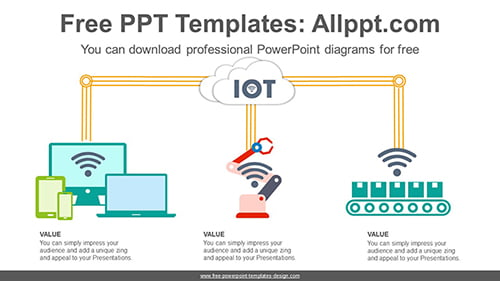
IOT System PowerPoint Diagram
This diagram is a design for an IOT system. Use it to emphasize the movement or direction of a process or workflow. It is also an editable graphic with text and icon placeholders. Search Keywords: PowerPoint, Diagram, template, presentation, graph, graphic, icons, infographic, information, idea, layout, data, design, process, progress, shape, step, symbol, concept, connection, […]
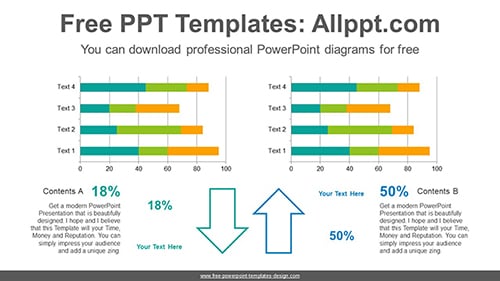
Stacked Bar Chart Compare PowerPoint Diagram
This diagram is a bar chart that compares the rise and fall by comparing the cumulative data. The numerical value of the data can be adjusted by simple numerical input. Search Keywords: template, presentation, graph, graphic, icons, infographic, information, idea, layout, data, design, process, progress, shape, step, symbol, concept, connection, creative, editable, analysis, analyze, audit, […]
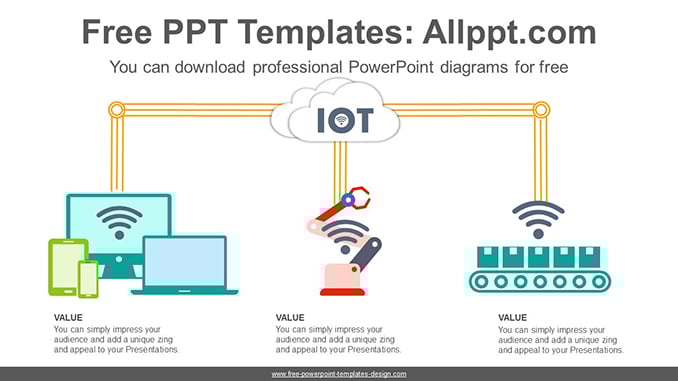

IOT System PowerPoint Diagram
/0 Comments/in Powerpoint Graphic Diagrams, PPT Charts /by adminaeThis diagram is a design for an IOT system. Use it to emphasize the movement or direction of a process or workflow. It is also an editable graphic with text and icon placeholders. Search Keywords: PowerPoint, Diagram, template, presentation, graph, graphic, icons, infographic, information, idea, layout, data, design, process, progress, shape, step, symbol, concept, connection, […]
Stacked Bar Chart Compare PowerPoint Diagram
/0 Comments/in Powerpoint Charts, PPT Charts /by adminaeThis diagram is a bar chart that compares the rise and fall by comparing the cumulative data. The numerical value of the data can be adjusted by simple numerical input. Search Keywords: template, presentation, graph, graphic, icons, infographic, information, idea, layout, data, design, process, progress, shape, step, symbol, concept, connection, creative, editable, analysis, analyze, audit, […]