Half Sized Blog Element (Single Author Style)
Half Sized Blog Element (Multi Author Style)
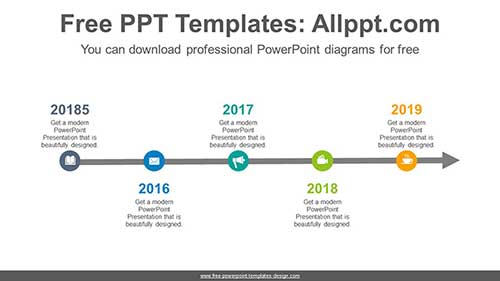
Simple dot point PowerPoint Diagram
This is a simple timeline diagram where the dot emphasis is the point. This timeline uses lines and colorful dot to visualize the flow of time. It is also an editable graphic with text and icon placeholders. Search Keywords: template, presentation, graph, graphic, icons, infographic, information, idea, layout, data, design, process, progress, shape, step, symbol, […]
People Icons Chart PowerPoint Diagram
This diagram is a chart that is represented as a sandglass and a person icon. This helps you visualize changes, comparisons, growth rates and more. You can express the formula by coloring the icon placeholders. Search Keywords: template, presentation, graph, icons, infographic, design, process, shape, editable, audit, business, chart, result, statistics, stats, people, men, women […]

Simple dot point PowerPoint Diagram
/0 Comments/in PPT Diagrams, Timeline Diagrams /by adminaeThis is a simple timeline diagram where the dot emphasis is the point. This timeline uses lines and colorful dot to visualize the flow of time. It is also an editable graphic with text and icon placeholders. Search Keywords: template, presentation, graph, graphic, icons, infographic, information, idea, layout, data, design, process, progress, shape, step, symbol, […]
People Icons Chart PowerPoint Diagram
/1 Comment/in Powerpoint Charts, PPT Charts /by adminaeThis diagram is a chart that is represented as a sandglass and a person icon. This helps you visualize changes, comparisons, growth rates and more. You can express the formula by coloring the icon placeholders. Search Keywords: template, presentation, graph, icons, infographic, design, process, shape, editable, audit, business, chart, result, statistics, stats, people, men, women […]