Half Sized Blog Element (Single Author Style)
Half Sized Blog Element (Multi Author Style)

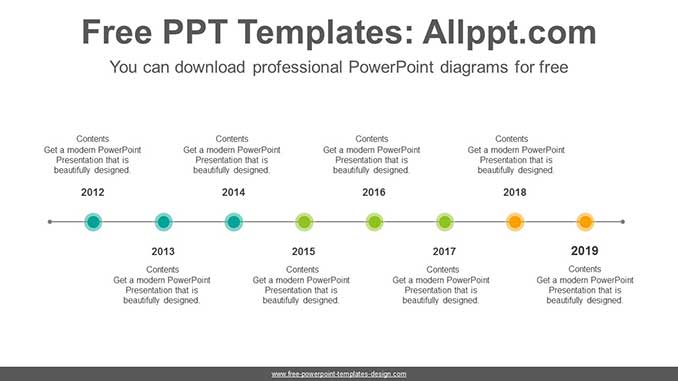
Simple Dots Point PowerPoint Diagram
This is a simple timeline diagram where the dot emphasis is the point. This timeline uses lines and colorful dot to visualize the flow of time. It is also an editable graphic with text and icon placeholders. Search Keywords: template, presentation, graph, graphic, icons, infographic, information, idea, layout, data, design, process, progress, shape, step, symbol, […]

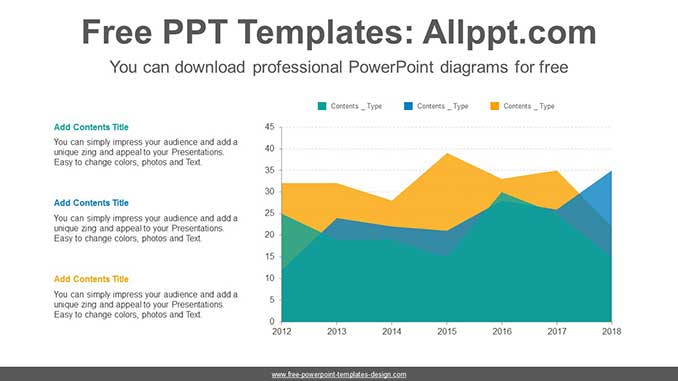
Area Chart List PowerPoint Diagram
This diagram is a chart that uses area charts and list. You can display the desired value simply by entering the formula. It’s good to visualize numbers in 3 colors. Search Keywords: template, presentation, graph, graphic, icons, infographic, information, idea, layout, data, design, process, progress, shape, step, symbol, concept, connection, creative, editable, analysis, analyze, audit, […]
Simple Dots Point PowerPoint Diagram
/0 Comments/in PPT Diagrams, Timeline Diagrams /by adminaeThis is a simple timeline diagram where the dot emphasis is the point. This timeline uses lines and colorful dot to visualize the flow of time. It is also an editable graphic with text and icon placeholders. Search Keywords: template, presentation, graph, graphic, icons, infographic, information, idea, layout, data, design, process, progress, shape, step, symbol, […]
Area Chart List PowerPoint Diagram
/1 Comment/in Powerpoint Charts, PPT Charts /by adminaeThis diagram is a chart that uses area charts and list. You can display the desired value simply by entering the formula. It’s good to visualize numbers in 3 colors. Search Keywords: template, presentation, graph, graphic, icons, infographic, information, idea, layout, data, design, process, progress, shape, step, symbol, concept, connection, creative, editable, analysis, analyze, audit, […]