Half Sized Blog Element (Single Author Style)
Half Sized Blog Element (Multi Author Style)
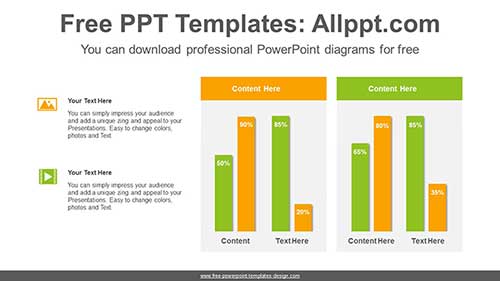
Bar Chart Comparative PPT Diagram
This diagram is a bar chart for comparing two pieces of data. A colorful charts has a visual effect. This pie chart can easily adjust numeric values with formula inputs. Search Keywords: PowerPoint, diagram, template, presentation, graph, graphic, icons, infographic, information, idea, layout, data, design, process, progress, shape, step, symbol, concept, connection, creative, editable, analysis, […]
Bend Line Arrow PowerPoint Diagram
This diagram is a circle design that flows along the bend of the line. It is appropriate to express time and work progress. It is also an editable graphic with text and icon placeholders. Search Keywords: PowerPoint, diagram, template, presentation, graph, graphic, icons, infographic, information, idea, layout, data, design, process, progress, shape, step, symbol, concept, […]
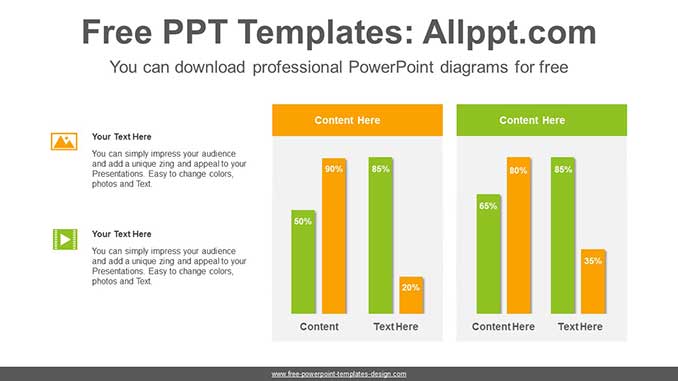
Bar Chart Comparative PPT Diagram
/16 Comments/in Powerpoint Charts, PPT Charts /by adminaeThis diagram is a bar chart for comparing two pieces of data. A colorful charts has a visual effect. This pie chart can easily adjust numeric values with formula inputs. Search Keywords: PowerPoint, diagram, template, presentation, graph, graphic, icons, infographic, information, idea, layout, data, design, process, progress, shape, step, symbol, concept, connection, creative, editable, analysis, […]
Bend Line Arrow PowerPoint Diagram
/0 Comments/in PPT Diagrams, Timeline Diagrams /by adminaeThis diagram is a circle design that flows along the bend of the line. It is appropriate to express time and work progress. It is also an editable graphic with text and icon placeholders. Search Keywords: PowerPoint, diagram, template, presentation, graph, graphic, icons, infographic, information, idea, layout, data, design, process, progress, shape, step, symbol, concept, […]