Half Sized Blog Element (Single Author Style)
Half Sized Blog Element (Multi Author Style)
Dotted Chevron PowerPoint Diagram
This diagram is a dotted chevron representation of a six-step time flow. It can describe flow, list, and timeline. It is also an editable graphic with text and icon placeholders. Search Keywords: PowerPoint, diagram, template, presentation, infographic, graph, graphic, data, design, process, progress, set, shape, step, symbol, concept, connection, creative, editable, timeline, line, simple, point, […]
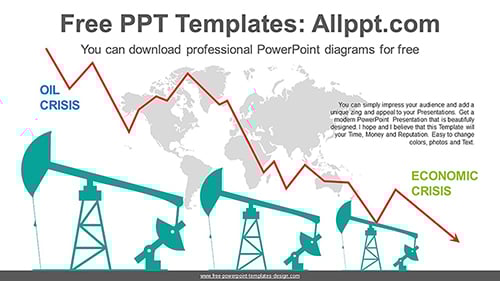
Oil Price Decline PowerPoint Diagram
This template is a design representing the decline in the global economy due to falling oil prices. This is a great way to express the impact of oil price indicators on the global economy. It’s also an editable graphic with text and icon placeholders. Search Keywords: PowerPoint, diagram, template, presentation, graph, icons, infographic, information, idea, […]

Dotted Chevron PowerPoint Diagram
/0 Comments/in PPT Diagrams, Timeline Diagrams /by adminaeThis diagram is a dotted chevron representation of a six-step time flow. It can describe flow, list, and timeline. It is also an editable graphic with text and icon placeholders. Search Keywords: PowerPoint, diagram, template, presentation, infographic, graph, graphic, data, design, process, progress, set, shape, step, symbol, concept, connection, creative, editable, timeline, line, simple, point, […]
Oil Price Decline PowerPoint Diagram
/0 Comments/in PPT Diagrams, Stair and Step Diagrams /by adminaeThis template is a design representing the decline in the global economy due to falling oil prices. This is a great way to express the impact of oil price indicators on the global economy. It’s also an editable graphic with text and icon placeholders. Search Keywords: PowerPoint, diagram, template, presentation, graph, icons, infographic, information, idea, […]