Half Sized Blog Element (Single Author Style)
Half Sized Blog Element (Multi Author Style)
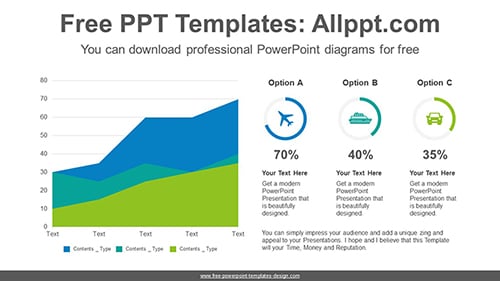
Area-donut chart PowerPoint Diagram Template
Area-donut chart PowerPoint Diagram Template: This diagram is a chart that uses area charts and donut charts at the same time. You can display the desired value simply by entering the formula. It’s good to visualize numbers in 3 colors. Search Keywords: PowerPoint, diagram, template, presentation, graph, graphic, icons, infographic, information, idea, layout, data, design, […]
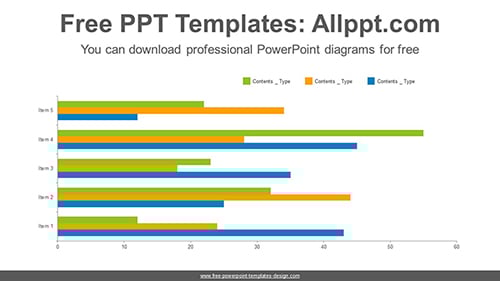
Full clustered bar chart PowerPoint Diagram Template
Full clustered bar chart PowerPoint Diagram Template: This diagram is a horizontally clustered bar graph that you can modify with simple formula input. The bar graph can be used to visualize the numerical value you want to display using the length or height of the bar. Search Keywords: PowerPoint, diagram, template, presentation, graph, graphic, icons, […]
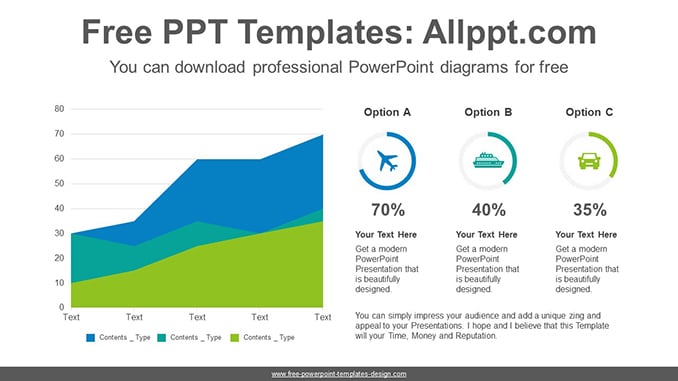
Area-donut chart PowerPoint Diagram Template
/0 Comments/in Powerpoint Charts, PPT Charts /by adminaeArea-donut chart PowerPoint Diagram Template: This diagram is a chart that uses area charts and donut charts at the same time. You can display the desired value simply by entering the formula. It’s good to visualize numbers in 3 colors. Search Keywords: PowerPoint, diagram, template, presentation, graph, graphic, icons, infographic, information, idea, layout, data, design, […]
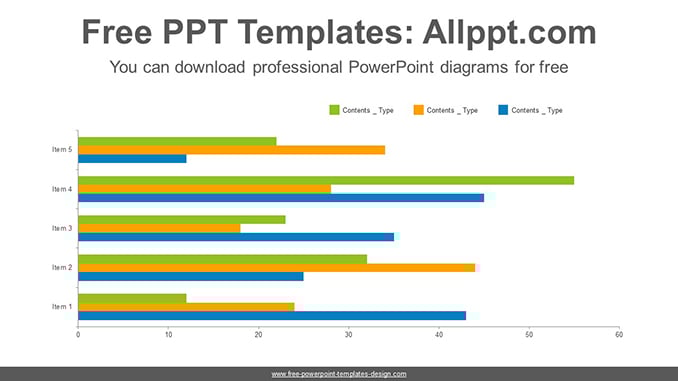
Full clustered bar chart PowerPoint Diagram Template
/0 Comments/in Powerpoint Charts, PPT Charts /by adminaeFull clustered bar chart PowerPoint Diagram Template: This diagram is a horizontally clustered bar graph that you can modify with simple formula input. The bar graph can be used to visualize the numerical value you want to display using the length or height of the bar. Search Keywords: PowerPoint, diagram, template, presentation, graph, graphic, icons, […]