Posts

User-Centric Innovation PowerPoint Templates

Featuring a sleek, dark background with a central glowing user icon, it conveys a sense of precision, selection, and focus on individuals in a digital environment. The radial arrangement of icons around the central figure symbolizes connectivity and data interaction, making it perfect for presentations on HR strategies, talent acquisition, user experience (UX), or digital transformation.

Search Keywords: user, interface, touch, digital, technology, network, profile, hr, recruitment, innovation, data, human, resources, ux, selection, management, business, corporate, future, tech, modern, glow, interaction, communication, organization, digitalization, talent, strategy, people, connection, user engagement, human resource management, digital networking, PowerPoint Templates, ppt, google slides

User-Centric Innovation PowerPoint Templates: It includes 48 slides

Features: User-Centric Innovation PowerPoint Templates
  • Fully and easily editable (shape color, size, and text)
  • This template has a color theme and will automatically apply color when copied and pasted
  • It includes a customizable icon family with 135 different icons(Fully editable)
  • Drag and drop image placeholder
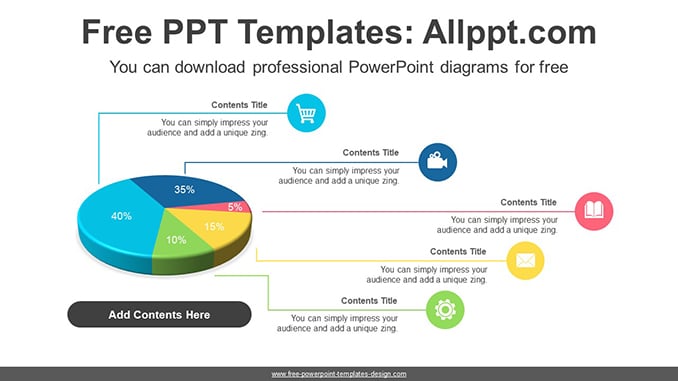
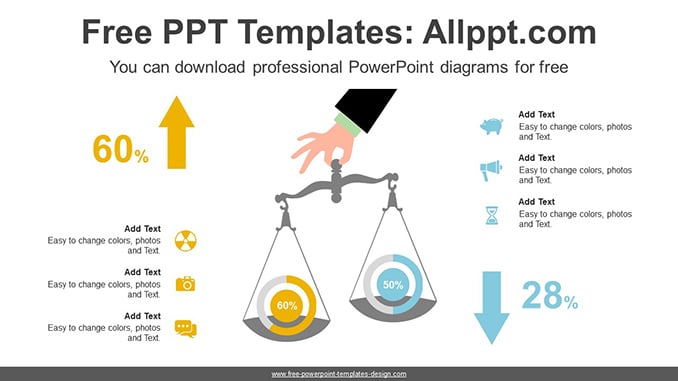
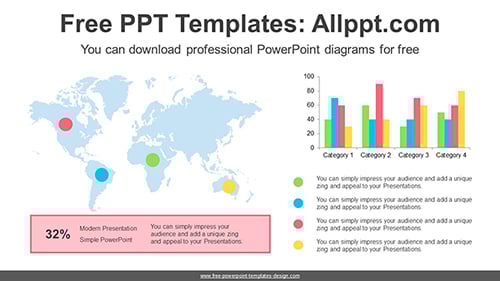
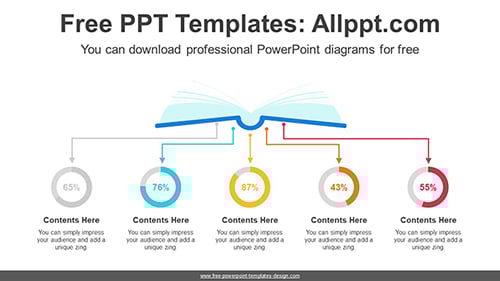
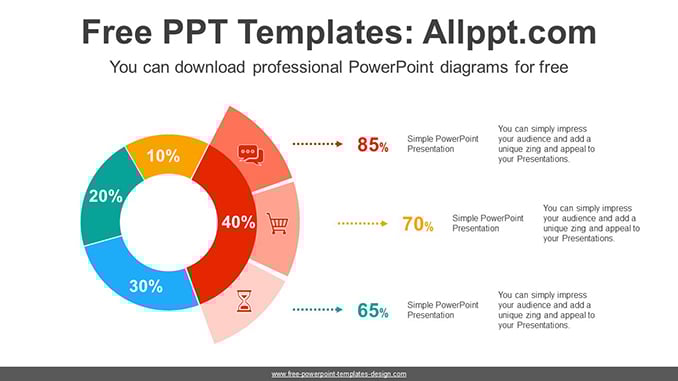
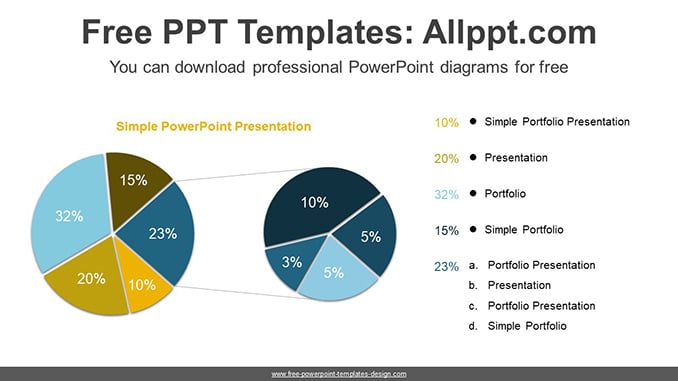
  • Easy editable data-driven charts (Editable via Excel)
  • Vector graphics 100% fully editable
  • Based on master slides
  • The aspect ratio of 16:9
  • All background images are included. The images used are AI-generated images and images from pixabay.com that have been reprocessed to fit the background image. But The pictures used for example in the image placeholder are not included (You can easily insert your images) => Example pictures copyright: pixabay.com
  • Our templates can be used for school classes, business purposes, and commercial purposes. But all images and graphics (shapes) in this template are produced by allppt.com. Redistribution of the template or the extraction graphics is completely prohibited.
Screenshots

You May Also Like

Scales Doughnut Chart Diagram Template

This diagram is a donut chart placed on a scale. Donut charts easily adjust numeric values with formula input. It is also an editable graphic for text, charts, and icon placeholders.

Search Keywords: PowerPoint, diagram, template, presentation, graph, icons, infographic, information, idea, graphic, data, design, process, progress, shape, step, concept, connection, creative, connected, editable, analysis, analyze, audit, business, chart, element, management, part, report, research, result, statistics, stats, table, vertical, scale, Doughnut, donut

Scales Doughnut Chart Diagram Template

This PowerPoint diagram template has theme color applied. So when you do simple copying and pasting, the color will be applied automatically. In addition, shapes and text are 100% editable

This ‘Scales Doughnut Chart Diagram Template’ Preview:

This template can be used for school classes, business purposes, and commercial purposes. However, this template cannot be distributed absolutely.

You May Also Like

Line-Bar Chart PowerPoint Diagram

This diagram shows two charts to compare data. This makes it easy to describe the data with simple charts and text lists. Doughnut-column charts are easy to adjust numeric values with formula input.

Search Keywords: PowerPoint, diagram, template, presentation, graph, graphic, icons, infographic, information, idea, layout, data, design, process, progress, shape, step, symbol, concept, connection, creative, editable, analysis, analyze, audit, business, chart, element, management, part, report, research, result, statistics, stats, column, chart, bar, Line

Line-Bar Chart PowerPoint Diagram

This PowerPoint diagram template has theme color applied. So when you do simple copying and pasting, the color will be applied automatically. In addition, shapes and text are 100% editable

This ‘Line-Bar Chart PowerPoint Diagram’ Preview:

This template can be used for school classes, business purposes, and commercial purposes. However, this template cannot be distributed absolutely.

You May Also Like

Thermometer Bar Chart PPT Diagram

This diagram is a bar graph thermometer chart. Data can be modified by simple numeric input. It is also an editable graphic with text and icon placeholders.

Search Keywords:: PowerPoint, diagram, template, presentation, graph, graphic, icons, infographic, information, idea, layout, data, design, process, progress, shape, step, symbol, concept, connection, creative, editable, analysis, analyze, audit, business, chart, element, management, part, report, research, result, statistics, stats, column, thermometer, chart, bar

Thermometer Bar Chart PPT Diagram

This PowerPoint diagram template has theme color applied. So when you do simple copying and pasting, the color will be applied automatically. In addition, shapes and text are 100% editable

This ‘Thermometer Bar Chart PPT Diagram’ Preview:

This template can be used for school classes, business purposes, and commercial purposes. However, this template cannot be distributed absolutely.

You May Also Like

3D Pie Chart PowerPoint Diagram

This diagram is a color 3D pie chart showing four data. A colorful chart has a visual effect. It is also an editable graphic for text, charts, and icon placeholders. These pie charts are easy to adjust numeric values with formula input.

Search Keywords: PowerPoint, diagram, template, presentation, graph, graphic, icons, infographic, information, idea, layout, data, design, process, progress, shape, step, symbol, concept, connection, creative, editable, analysis, analyze, audit, business, chart, element, management, part, report, research, result, statistics, stats, split, pie, circle, four

3D Pie Chart PowerPoint Diagram

This PowerPoint diagram template has theme color applied. So when you do simple copying and pasting, the color will be applied automatically. In addition, shapes and text are 100% editable

This ‘3D Pie Chart PowerPoint Diagram’ Preview:

This template can be used for school classes, business purposes, and commercial purposes. However, this template cannot be distributed absolutely.

You May Also Like

Scales Doughnut Chart PPT Diagram

This diagram is a donut chart placed on a scale. Donut charts are easy to adjust numeric values with formula input. It is also an editable graphic for text, charts, and icon placeholders.

Search Keywords: PowerPoint, diagram, template, presentation, graph, icons, infographic, information, idea, graphic, data, design, process, progress, shape, step, concept, connection, creative, connected, editable, analysis, analyze, audit, business, chart, element, management, part, report, research, result, statistics, stats, table, vertical, scale, Doughnut, donut

Scales Doughnut Chart PPT Diagram

This PowerPoint diagram template has theme color applied. So when you do simple copying and pasting, the color will be applied automatically. In addition, shapes and text are 100% editable

This ‘Scales Doughnut Chart PPT Diagram’ Preview:

This template can be used for school classes, business purposes, and commercial purposes. However, this template cannot be distributed absolutely.

You May Also Like

World Map Bar Chart PowerPoint Diagram

This diagram is a clustered bar graph that is represented as a world map. This clustered bar graph helps you visualize changes, comparisons, growth rates, and more. You can also modify data with simple formula input.

Search Keywords: template, presentation, graph, graphic, icons, infographic, information, idea, layout, data, design, process, progress, shape, step, symbol, concept, connection, creative, editable, analysis, analyze, audit, business, chart, element, management, part, report, research, result, statistics, stats, clustered, bar, simple

World Map Bar Chart PowerPoint Diagram

This PowerPoint diagram template has theme color applied. So when you do simple copying and pasting, the color will be applied automatically. In addition, shapes and text are 100% editable

This ‘World Map Bar Chart PowerPoint Diagram’ Preview:

This template can be used for school classes, business purposes, and commercial purposes. However, this template cannot be distributed absolutely.

You May Also Like

Five Doughnut Charts PPT Diagram

This diagram is designed to sort and compare five donut charts. This makes it easy to describe the data with simple charts and text lists. Doughnut charts are easy to adjust numeric values with formula input.

Search Keywords: PowerPoint, diagram, template, presentation, graph, icons, infographic, information, idea, graphic, data, design, process, progress, shape, step, concept, connection, creative, connected, editable, analysis, analytics, analyze, audit, business, chart, circle, circular, donuts, doughnut, element, finance, graph, management, part, pie, report, research, result, round, statistics, stats, visualization, simple, Comparative, compare, donut, doughnut, book, education, reading, student

Five Doughnut Charts PPT Diagram

This PowerPoint diagram template has theme color applied. So when you do simple copying and pasting, the color will be applied automatically. In addition, shapes and text are 100% editable

This ‘Five Doughnut Charts PPT Diagram’ Preview:

This template can be used for school classes, business purposes, and commercial purposes. However, this template cannot be distributed absolutely.

You May Also Like

Doughnut Chart Diagram Template

This diagram makes a large donut chart visually appealing. This makes it easy to describe the data with simple charts and text lists. Doughnut charts are easy to adjust numeric values with formula input.

Search Keywords: template, presentation, graph, icons, infographic, information, idea, graphic, data, design, process, progress, shape, step, concept, connection, creative, connected, editable, analysis, analytics, analyze, audit, business, chart, circle, circular, donuts, doughnut, element, finance, graph, management, part, pie, report, research, result, round, statistics, stats, visualization, simple

Doughnut Chart Diagram Template

This PowerPoint diagram template has theme color applied. So when you do simple copying and pasting, the color will be applied automatically. In addition, shapes and text are 100% editable

This ‘Doughnut Chart Diagram Template’ Preview:

This template can be used for school classes, business purposes, and commercial purposes. However, this template cannot be distributed absolutely.

You May Also Like

Pie To Pie Chart PowerPoint Diagram

This diagram is a Pie To Pie chart design. Two pie charts complement each other to record numbers. It is also an editable graphic for text, charts, and icon placeholders. Pie charts are easy to adjust numeric values with formula input.

Search Keywords: diagram, template, presentation, graph, icons, infographic, information, idea, graphic, data, design, process, progress, shape, step, concept, connection, creative, connected, editable, analysis, analytics, analyze, audit, business, chart, circle, circular, donuts, doughnut, element, finance, graph, management, part, pie, report, research, result, round, statistics, stats, visualization, simple, pie, pie to pie chart

Pie To Pie Chart PowerPoint Diagram

This PowerPoint diagram template has theme color applied. So when you do simple copying and pasting, the color will be applied automatically. In addition, shapes and text are 100% editable

This ‘Pie To Pie Chart PowerPoint Diagram’ Preview:

This template can be used for school classes, business purposes, and commercial purposes. However, this template cannot be distributed absolutely.

You May Also Like