Half Sized Blog Element (Single Author Style)
Half Sized Blog Element (Multi Author Style)

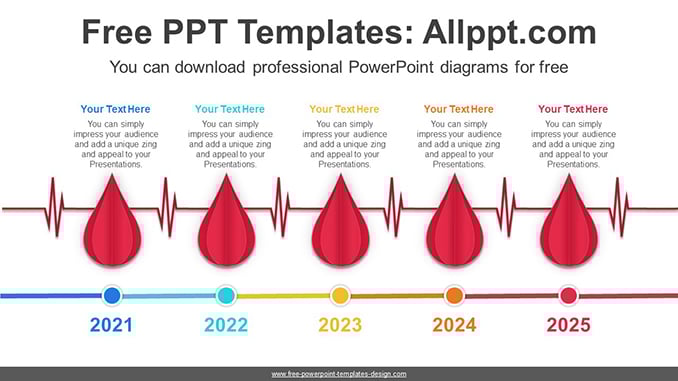
Blood Donation Diagram Template
This diagram is a visualized design of blood donation. It shows the passage of time through blood and pulse indicators. It is also an editable graphic with text and icon placeholders. Search Keywords: template, presentation, graph, graphic, icons, infographic, information, idea, layout, data, design, process, progress, shape, step, symbol, concept, connection, creative, editable, timeline, alternating, […]
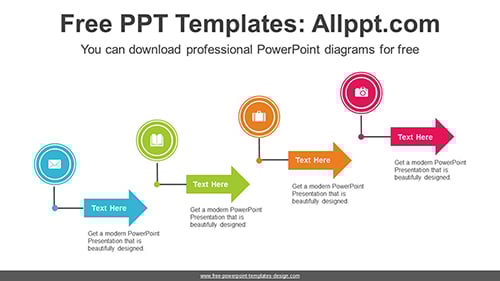
Cascading Arrows Diagram Template
This is a 4-step cascading banner diagram. This diagram places a banner with ascending arrows cascading up. It is also an editable graphic for color conversion and text and icon placeholders. Search Keywords: PowerPoint, diagram, template, presentation, graph, graphic, icons, infographic, information, idea, layout, data, design, process, progress, shape, step, symbol, concept, connection, creative, editable, […]

Blood Donation Diagram Template
/0 Comments/in PPT Diagrams, Timeline Diagrams /by adminaeThis diagram is a visualized design of blood donation. It shows the passage of time through blood and pulse indicators. It is also an editable graphic with text and icon placeholders. Search Keywords: template, presentation, graph, graphic, icons, infographic, information, idea, layout, data, design, process, progress, shape, step, symbol, concept, connection, creative, editable, timeline, alternating, […]
Cascading Arrows Diagram Template
/0 Comments/in PPT Diagrams, Stair and Step Diagrams /by adminaeThis is a 4-step cascading banner diagram. This diagram places a banner with ascending arrows cascading up. It is also an editable graphic for color conversion and text and icon placeholders. Search Keywords: PowerPoint, diagram, template, presentation, graph, graphic, icons, infographic, information, idea, layout, data, design, process, progress, shape, step, symbol, concept, connection, creative, editable, […]