Half Sized Blog Element (Single Author Style)
Half Sized Blog Element (Multi Author Style)
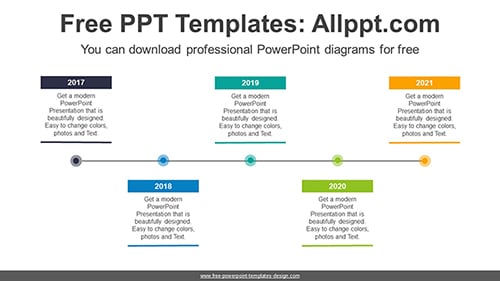
Simple Line Banner PowerPoint diagram
This diagram is a simple timeline with lines, dots, and rectangles. This timeline visualizes the flow of time using lines, dots, and graphics. It is also an editable graphic with text and icon placeholders. Search Keywords: PowerPoint, diagram, template, presentation, graph, graphic, icons, infographic, information, idea, layout, data, design, process, progress, shape, step, symbol, concept, […]
Global Ascending Arrow PPT Diagram
This diagram is a design with 4 steps up arrow and global. Use this template to display a four-step rising list. It is also an editable graphic with text and icon placeholders. Use this template to display a four-step rising list. It is also an editable graphic with text and icon placeholders. Search Keywords: PowerPoint, […]
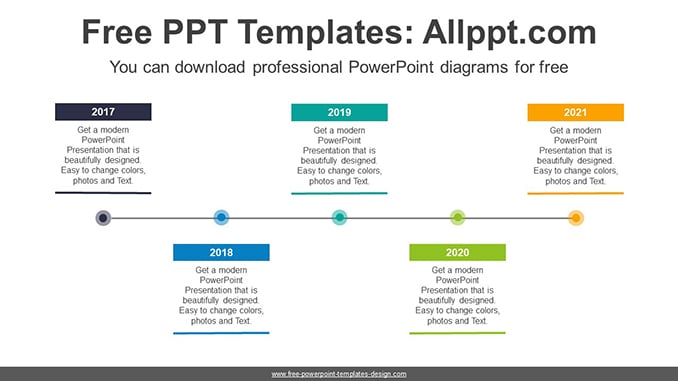
Simple Line Banner PowerPoint diagram
/3 Comments/in PPT Diagrams, Timeline Diagrams /by adminaeThis diagram is a simple timeline with lines, dots, and rectangles. This timeline visualizes the flow of time using lines, dots, and graphics. It is also an editable graphic with text and icon placeholders. Search Keywords: PowerPoint, diagram, template, presentation, graph, graphic, icons, infographic, information, idea, layout, data, design, process, progress, shape, step, symbol, concept, […]
Global Ascending Arrow PPT Diagram
/1 Comment/in PPT Diagrams, Stair and Step Diagrams /by adminaeThis diagram is a design with 4 steps up arrow and global. Use this template to display a four-step rising list. It is also an editable graphic with text and icon placeholders. Use this template to display a four-step rising list. It is also an editable graphic with text and icon placeholders. Search Keywords: PowerPoint, […]