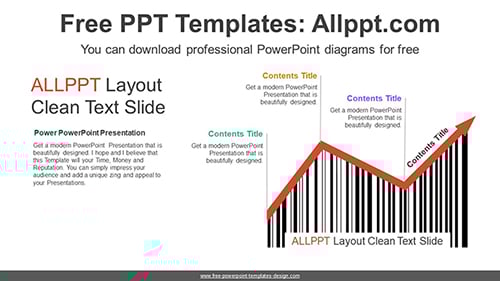
Barcode Up Rising Arrows PowerPoint Diagram
This diagram is an arrow design that repeats rising and falling across a barcode. This is good for explaining the rise and fall of prices and changes in sales success. It is also an editable graphic with text and icon placeholders.
Search Keywords: PowerPoint, diagram, template, presentation, graph, graphic, icons, infographic, information, idea, layout, data, design, process, progress, shape, step, symbol, concept, connection, creative, editable, rise, staircase, up, growth, stacked, rising, arrow, barcode, fall, prices, sales, success, business
Barcode Up Rising Arrows PowerPoint Diagram
This PowerPoint diagram template has theme color applied. So when you do simple copying and pasting, the color will be applied automatically. In addition, shapes and text are 100% editable
This ‘Barcode Up Rising Arrows PowerPoint Diagram’ Preview:

This template can be used for school classes, business purposes, and commercial purposes. However, this template cannot be distributed absolutely.
You May Also Like