 https://www.free-powerpoint-templates-design.com/wp-content/uploads/2023/06/Clustered-Bar-Charts-PowerPoint-Diagram-list-image.jpg
281
500
adminae
https://www.free-powerpoint-templates-design.com/wp-content/uploads/2016/06/allppt-logo-h30.png
adminae2023-07-03 01:12:562023-06-26 03:15:45Clustered Bar Charts PowerPoint Diagram
https://www.free-powerpoint-templates-design.com/wp-content/uploads/2023/06/Clustered-Bar-Charts-PowerPoint-Diagram-list-image.jpg
281
500
adminae
https://www.free-powerpoint-templates-design.com/wp-content/uploads/2016/06/allppt-logo-h30.png
adminae2023-07-03 01:12:562023-06-26 03:15:45Clustered Bar Charts PowerPoint Diagram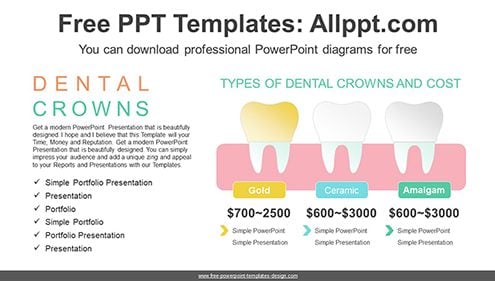 https://www.free-powerpoint-templates-design.com/wp-content/uploads/2023/06/Tooth-Crowns-Treatment-PowerPoint-Diagram-list-image.jpg
281
500
adminae
https://www.free-powerpoint-templates-design.com/wp-content/uploads/2016/06/allppt-logo-h30.png
adminae2023-07-02 01:02:172023-06-26 03:22:29Tooth Crowns Treatment PowerPoint Diagram
https://www.free-powerpoint-templates-design.com/wp-content/uploads/2023/06/Tooth-Crowns-Treatment-PowerPoint-Diagram-list-image.jpg
281
500
adminae
https://www.free-powerpoint-templates-design.com/wp-content/uploads/2016/06/allppt-logo-h30.png
adminae2023-07-02 01:02:172023-06-26 03:22:29Tooth Crowns Treatment PowerPoint Diagram https://www.free-powerpoint-templates-design.com/wp-content/uploads/2023/06/Circle-Arrows-PowerPoint-Diagram-list-image.jpg
281
500
adminae
https://www.free-powerpoint-templates-design.com/wp-content/uploads/2016/06/allppt-logo-h30.png
adminae2023-07-01 01:53:082023-06-26 02:55:25Circle Arrows PowerPoint Diagram
https://www.free-powerpoint-templates-design.com/wp-content/uploads/2023/06/Circle-Arrows-PowerPoint-Diagram-list-image.jpg
281
500
adminae
https://www.free-powerpoint-templates-design.com/wp-content/uploads/2016/06/allppt-logo-h30.png
adminae2023-07-01 01:53:082023-06-26 02:55:25Circle Arrows PowerPoint Diagram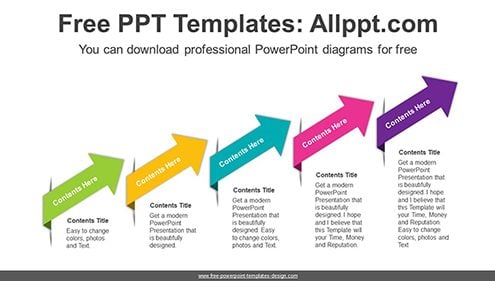 https://www.free-powerpoint-templates-design.com/wp-content/uploads/2023/06/Rising-Folded-Arrows-PowerPoint-Diagram-list-image.jpg
281
500
adminae
https://www.free-powerpoint-templates-design.com/wp-content/uploads/2016/06/allppt-logo-h30.png
adminae2023-06-30 01:31:582023-06-26 02:48:09Rising Folded Arrows PowerPoint Diagram
https://www.free-powerpoint-templates-design.com/wp-content/uploads/2023/06/Rising-Folded-Arrows-PowerPoint-Diagram-list-image.jpg
281
500
adminae
https://www.free-powerpoint-templates-design.com/wp-content/uploads/2016/06/allppt-logo-h30.png
adminae2023-06-30 01:31:582023-06-26 02:48:09Rising Folded Arrows PowerPoint Diagram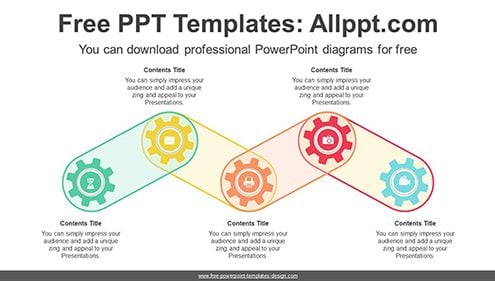 https://www.free-powerpoint-templates-design.com/wp-content/uploads/2023/06/Wheels-Rotating-Gear-PowerPoint-Diagram-Template-list-image.jpg
281
500
adminae
https://www.free-powerpoint-templates-design.com/wp-content/uploads/2016/06/allppt-logo-h30.png
adminae2023-06-29 01:20:072023-06-26 02:23:14Wheels Rotating Gear PowerPoint Diagram Template
https://www.free-powerpoint-templates-design.com/wp-content/uploads/2023/06/Wheels-Rotating-Gear-PowerPoint-Diagram-Template-list-image.jpg
281
500
adminae
https://www.free-powerpoint-templates-design.com/wp-content/uploads/2016/06/allppt-logo-h30.png
adminae2023-06-29 01:20:072023-06-26 02:23:14Wheels Rotating Gear PowerPoint Diagram Template https://www.free-powerpoint-templates-design.com/wp-content/uploads/2023/06/Business-Umbrella-PowerPoint-Diagram-Template-list-image.jpg
281
500
adminae
https://www.free-powerpoint-templates-design.com/wp-content/uploads/2016/06/allppt-logo-h30.png
adminae2023-06-28 01:10:532023-06-26 02:14:33Business Umbrella PowerPoint Diagram Template
https://www.free-powerpoint-templates-design.com/wp-content/uploads/2023/06/Business-Umbrella-PowerPoint-Diagram-Template-list-image.jpg
281
500
adminae
https://www.free-powerpoint-templates-design.com/wp-content/uploads/2016/06/allppt-logo-h30.png
adminae2023-06-28 01:10:532023-06-26 02:14:33Business Umbrella PowerPoint Diagram Template