 https://www.free-powerpoint-templates-design.com/wp-content/uploads/2022/08/Big-Data-Vertical-Bar-Chart-PPT-Diagram-list-image.jpg
281
500
adminae
https://www.free-powerpoint-templates-design.com/wp-content/uploads/2016/06/allppt-logo-h30.png
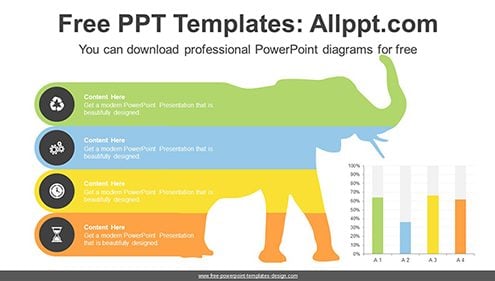
adminae2022-08-13 01:45:022022-08-12 01:46:06Big Data Vertical Bar Chart PPT Diagram
https://www.free-powerpoint-templates-design.com/wp-content/uploads/2022/08/Big-Data-Vertical-Bar-Chart-PPT-Diagram-list-image.jpg
281
500
adminae
https://www.free-powerpoint-templates-design.com/wp-content/uploads/2016/06/allppt-logo-h30.png
adminae2022-08-13 01:45:022022-08-12 01:46:06Big Data Vertical Bar Chart PPT Diagram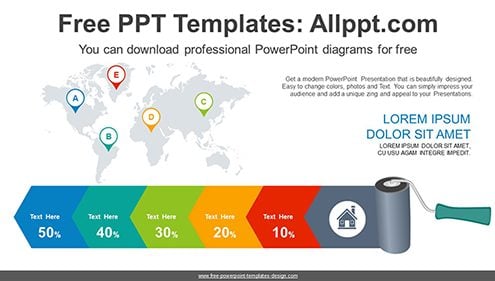 https://www.free-powerpoint-templates-design.com/wp-content/uploads/2022/08/Paint-Roller-Painting-PowerPoint-Diagram-list-image.jpg
281
500
adminae
https://www.free-powerpoint-templates-design.com/wp-content/uploads/2016/06/allppt-logo-h30.png
adminae2022-08-12 01:32:582022-08-12 01:32:58Paint Roller Painting PowerPoint Diagram
https://www.free-powerpoint-templates-design.com/wp-content/uploads/2022/08/Paint-Roller-Painting-PowerPoint-Diagram-list-image.jpg
281
500
adminae
https://www.free-powerpoint-templates-design.com/wp-content/uploads/2016/06/allppt-logo-h30.png
adminae2022-08-12 01:32:582022-08-12 01:32:58Paint Roller Painting PowerPoint Diagram https://www.free-powerpoint-templates-design.com/wp-content/uploads/2022/08/Piggy-Bank-Rocket-PowerPoint-Templates-list.gif
236
400
adminae
https://www.free-powerpoint-templates-design.com/wp-content/uploads/2016/06/allppt-logo-h30.png
adminae2022-08-12 01:25:332022-08-12 01:25:33Piggy Bank Rocket PowerPoint Templates
https://www.free-powerpoint-templates-design.com/wp-content/uploads/2022/08/Piggy-Bank-Rocket-PowerPoint-Templates-list.gif
236
400
adminae
https://www.free-powerpoint-templates-design.com/wp-content/uploads/2016/06/allppt-logo-h30.png
adminae2022-08-12 01:25:332022-08-12 01:25:33Piggy Bank Rocket PowerPoint Templates