Posts

Stock Market Investment PowerPoint Templates

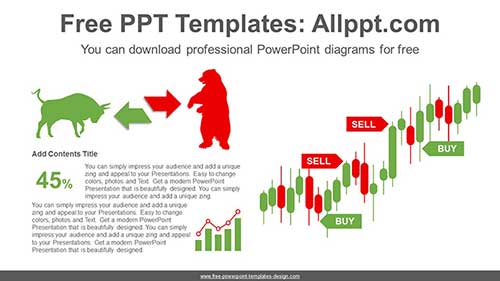
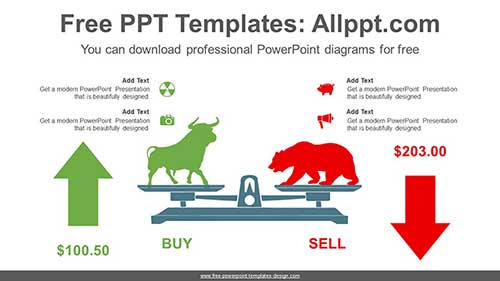
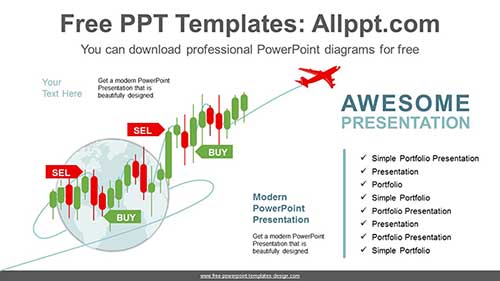
This diagram is a 3D crossword cube and world map design. It presents the profit, risk, and loss of the stock market. It is free-form and can be used for a variety of purposes. This is easy to modify and pictures made with shapes can enrich the template.

Search Keywords: 3D, analysis, balance, bear, block, blocks, board, bright, budget, bull, business, buy, calculation, candlestick, chart, commerce, concept, crossword, cube, currency, data, depression, desk, diagram, earning, economic, economy, exchange, finance, financial, forex, gain, exchange, generated, graphic, growth, icon, illustration, income, invest, investment, letter, letters, loss, made, making, management, market, marketing, money, motivation, plan, price, profit, purchase, puzzle, recession, retail, risk, savings, stick, stock, strategy, success, symbol, technical analysis, terms, text, trading, trend, wealth, word, word cross, world map, PowerPoint Templates, ppt, google slides

Stock Market Investment PowerPoint Templates: It includes 48 slides

Features: Stock Market Investment PowerPoint Templates
  • Fully and easily editable (shape color, size, and text)
  • This template has a color theme and will automatically apply color when copied and pasted
  • It includes a customizable icon family with 135 different icons(Fully editable)
  • Drag and drop image placeholder
  • Easy editable data-driven charts (Editable via Excel)
  • Vector graphics 100% fully editable
  • Based on master slides
  • The aspect ratio of 16:9
  • All background images are included. But The pictures used for example in the image placeholder are not included (You can easily insert your images) => Example pictures copyright: pixabay.com
  • Our templates can be used for school classes, business purposes, and commercial purposes. But all images and graphics (shapes) in this template are produced by allppt.com. Redistribution of the template or the extraction graphics is completely prohibited.
Screenshots

You May Also Like

Digital Dollar Sign PowerPoint Templates

This is a digital dollar sign illustration design. This diagram is a concept of pressing a digital dollar sign on a black virtual background. It is a free form and can be used for a variety of purposes. Pictures made with shapes can enrich the template.

Search Keywords: advisory, analysis, analytics, analyzing, background, banking, business, businessman, cash, chart, company, concept, currency, data, diagram, digital, dollar, economic, economy, finance, financial, global, graph, graphic, hand, high, illustration, infographic, information, innovation, international, investment, management, map, market, marketing, money, person, plan, profit, progress, report, savings, screen, sign, statistic, stock, strategy, success, tech, technology, trade, wealth, world, wide, PowerPoint Templates, ppt, google slides

Digital Dollar Sign PowerPoint Templates: It includes 48 slides

Features: Digital Dollar Sign PowerPoint Templates
  • Fully and easily editable (shape color, size, and text)
  • This template has a color theme and will automatically apply color when copied and pasted
  • It includes a customizable icon family with 135 different icons(Fully editable)
  • Drag and drop image placeholder
  • Easy editable data-driven charts (Editable via Excel)
  • Vector graphics 100% fully editable
  • Based on master slides
  • The aspect ratio of 16:9
  • All background images are included. But The pictures used for example in the image placeholder are not included (You can easily insert your images) => Example pictures copyright: pixabay.com
  • Our templates can be used for school classes, business purposes, and commercial purposes. But all images and graphics (shapes) in this template are produced by allppt.com. Redistribution of the template or the extraction graphics is completely prohibited.
Screenshots

You May Also Like

Trading Chart PowerPoint Diagram

This diagram is a stock trading chart design. This shows a rising graph of selling stock buying. It is also an editable graphic with text and icon placeholders.

Search Keywords: template, presentation, graph, icons, infographic, information, idea, layout, graph, graphic, data, design, process, progress, set, shape, step, success, symbol, sign, concept, connection, creative, planning, connected, editable, four, rise, staircase, up, stock, trading, selling, buying, market, oil, gold, ftures

Trading Chart PowerPoint Diagram

This PowerPoint diagram template has theme color applied. So when you do simple copying and pasting, the color will be applied automatically. In addition, shapes and text are 100% editable

This ‘Trading Chart PowerPoint Diagram’ Preview:

This template can be used for school classes, business purposes, and commercial purposes. However, this template cannot be distributed absolutely.

You May Also Like

Oil Crisis PowerPoint Templates

This template is a design of oil market crisis concept. This is a double exposure image of an oil pump, chart, and business man. This is easy to use and can enrich your templates.

Search Keywords: arrow, business, business man, black, chart, chemistry, cost, crash, crisis, diagram, digital, down, drill, drop, economic, economy, energy, environment, equipment, finance, fossil, gasoline, global, graph, illustration, industry, market, exposure, oil, oilfield, orange, power, price, pump, render, resource, red, silhouette, stock, technology, toning

Oil Crisis PowerPoint Templates: It includes 48 slides

Features: Oil Crisis PowerPoint Templates
  • Fully and easily editable (shape color, size, and text)
  • This template has a color theme and will automatically apply color when copied and pasted
  • It includes a customizable icon family with 135 different icons(Fully editable)
  • Drag and drop image placeholder
  • Easy editable data-driven charts (Editable via Excel)
  • Vector graphics 100% fully editable
  • Based on master slides
  • The aspect ratio of 16:9
  • All background images are included. But The pictures used for example in the image placeholder are not included (You can easily insert your images) => Example pictures copyright: pixabay.com
  • Our templates can be used for school classes, business purposes, and commercial purposes. But all images and graphics (shapes) in this template are produced by allppt.com. Redistribution of the template or the extraction graphics is completely prohibited.
Screenshots

You May Also Like

Abstract City Arrows PowerPoint Templates

This template demonstrates women’s confidence on an abstract urban background with up arrow. It designed the growth of finance and business as a double exposure. We always want a successful presentation.

Search Keywords:abstract, achievement, arrow, background, bar, building, business, businessman, chart, city, closeup, concept, diagram, double, downtown, drawing, economic, economy, exposure, female, finance, financial, foreground, future, girl, glasses, graph, graphic, growth, hand, improvement, increase, investment, male, man ,manager, market, woman, money, pen, people, pointing, price, professional, profit, progress, red, rise, rising, skyline, stock, success, suit, sunset, up, white, work, PowerPoint Templates, ppt, google slides

Abstract City Arrows PowerPoint Templates: It includes 48 slides

Features: Abstract City Arrows PowerPoint Templates
  • Fully and easily editable (shape color, size, and text)
  • This template has a color theme and will automatically apply color when copied and pasted
  • It includes a customizable icon family with 135 different icons(Fully editable)
  • Drag and drop image placeholder
  • Easy editable data-driven charts (Editable via Excel)
  • Vector graphics 100% fully editable
  • Based on master slides
  • The aspect ratio of 16:9
  • All background images are included. But The pictures used for example in the image placeholder are not included (You can easily insert your images) => Example pictures copyright: pixabay.com
  • Our templates can be used for school classes, business purposes, and commercial purposes. But all images and graphics (shapes) in this template are produced by allppt.com. Redistribution of the template or the extraction graphics is completely prohibited.
Screenshots

You May Also Like

Stock Trading Chart PowerPoint Diagram-list image

Stock Trading Chart PowerPoint Diagram

This diagram is a stock trading chart design. This shows a rising graph of selling stock buying. It is also an editable graphic with text and icon placeholders.

Search Keywords: template, presentation, graph, icons, infographic, information, idea, layout, graph, graphic, data, design, process, progress, set, shape, step, success, symbol, sign, concept, connection, creative, planning, connected, editable, four, rise, staircase, up, stock, trading, selling, buying, market

Stock Trading Chart PowerPoint Diagram

This PowerPoint diagram template has theme color applied. So when you do simple copying and pasting, the color will be applied automatically. In addition, shapes and text are 100% editable

This ‘Stock Trading Chart PowerPoint Diagram’ Preview:

Stock Trading Chart PowerPoint Diagram-post image

This template can be used for school classes, business purposes, and commercial purposes. However, this template cannot be distributed absolutely.

You May Also Like

Facing Stocks Selling PPT Diagram-list image

Facing Stocks Selling PPT Diagram

This diagram shows stock repurchases and the facing of the sell. Explain two concepts that are opposed by two arrows. It is also an editable graphic with text and icon placeholders.

Search Keywords: template, presentation, graph, icons, infographic, information, idea, layout, graph, graphic, graphics, data, design, process, progress, shape, step, banner, symbol, technology, sign, concept, connection, creative, planning, connected, editable, arrow, contrast, compare, opposite, two, stock, repurchases, facing, sell, Bear, bull, Trading, business, deal

Facing Stocks Selling PPT Diagram

This PowerPoint diagram template has theme color applied. So when you do simple copying and pasting, the color will be applied automatically. In addition, shapes and text are 100% editable

This ‘Facing Stocks Selling PPT Diagram’ Preview:

Facing Stocks Selling PPT Diagram-post image

This template can be used for school classes, business purposes, and commercial purposes. However, this template cannot be distributed absolutely.

You May Also Like

Stock Analysis PowerPoint Diagram-list image

Stock Analysis PowerPoint Diagram

This symbolizes the analysis of stocks through a magnifying glass zoom. It is also an editable graphic with text and icon placeholders.

Search Keywords: template, presentation, graph, icons, infographic, information, idea, illustration, layout, graph, graphic, graphics, data, design, process, progress, set, shape, step, banner, success, symbol, technology, sign, concept, connection, creative, planning, connected, editable, arrow, contrast, compare, opposite, two, up, down, analyz, stock, chart, Magnifying Glass

Stock Analysis PowerPoint Diagram

This PowerPoint diagram template has theme color applied. So when you do simple copying and pasting, the color will be applied automatically. In addition, shapes and text are 100% editable

This ‘Stock Analysis PowerPoint Diagram’ Preview:

Stock Analysis PowerPoint Diagram-post image

This template can be used for school classes, business purposes, and commercial purposes. However, this template cannot be distributed absolutely.

You May Also Like

Stock Horizontal Balance PowerPoint Diagram-list image

Stock Horizontal Balance PowerPoint Diagram

This diagram is a stock horizontal scale and two opposite arrows design. This compares importance with the slope of the horizontal balance. It is also an editable graphic with text and icon placeholders.

Search Keywords: template, presentation, graph, icons, infographic, information, idea, illustration, layout, graph, graphic, graphics, data, design, process, progress, set, shape, step, banner, success, symbol, technology, sign, concept, connection, creative, planning, connected, editable, contrast, compare, opposite, two, up, reverse, arrow, opposite, direction, horizontal, balance, stock, Bull, bear, buy, sell

Stock Horizontal Balance PowerPoint Diagram

This PowerPoint diagram template has theme color applied. So when you do simple copying and pasting, the color will be applied automatically. In addition, shapes and text are 100% editable

This ‘Stock Horizontal Balance PowerPoint Diagram’ Preview:

Stock Horizontal Balance PowerPoint Diagram-post image

This template can be used for school classes, business purposes, and commercial purposes. However, this template cannot be distributed absolutely.

You May Also Like

Stock Rise Chart PowerPoint Diagram-list image

Stock Rise Chart PowerPoint Diagram

This diagram represents a stock rise chart through an airplane crossing the earth. This can highlight visual effects with stock rise chart. It is also an editable graphic with text and icon placeholders.

Search Keywords: template, presentation, graph, graphic, icons, infographic, information, idea, layout, data, design, process, progress, shape, step, symbol, concept, connection, creative, editable, rise, staircase, up, growth, arrow, upward, success, stock, chart, airplane, earth, global

Stock Rise Chart PowerPoint Diagram

This PowerPoint diagram template has theme color applied. So when you do simple copying and pasting, the color will be applied automatically. In addition, shapes and text are 100% editable

This ‘Stock Rise Chart PowerPoint Diagram’ Preview:

Stock Rise Chart PowerPoint Diagram-post image

This template can be used for school classes, business purposes, and commercial purposes. However, this template cannot be distributed absolutely.

You May Also Like