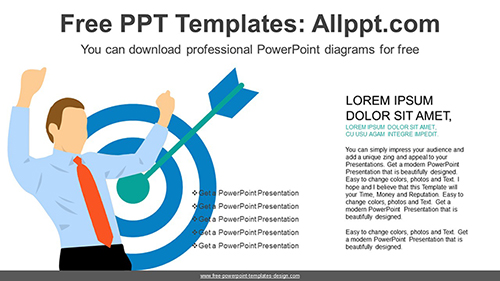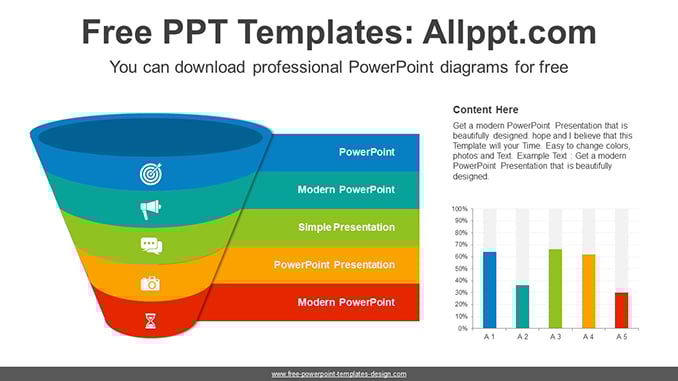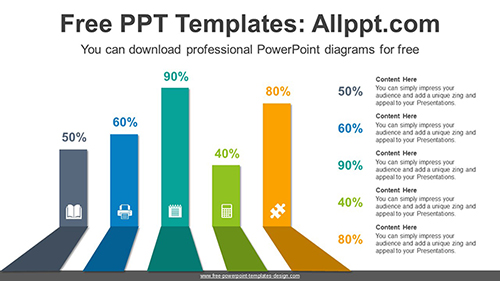
Target Bar Chart PowerPoint Diagram
This diagram is a bar chart with a businessman with a target. This makes it easy to describe your data with simple charts and text lists. Bar charts allow you to easily adjust numeric values by entering formulas.
Search Keywords: diagram, template, presentation, graph, graphic, icons, infographic, information, idea, layout, data, design, process, progress, shape, step, symbol, concept, connection, creative, editable, analysis, analyze, audit, business, chart, element, management, part, report, research, result, statistics, stats, stacked, horizontal, bar, target, businessman
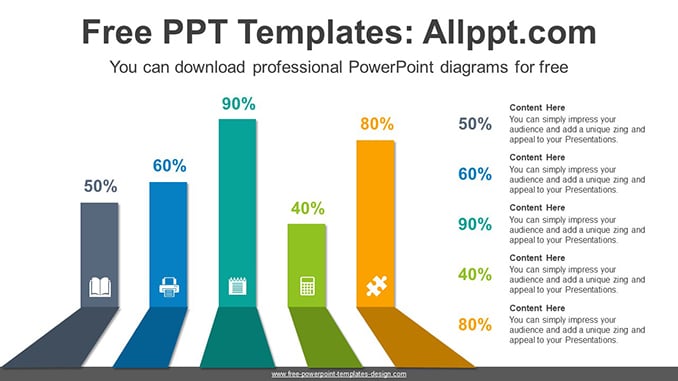
Target Bar Chart PowerPoint Diagram
This PowerPoint diagram template has theme color applied. So when you do simple copying and pasting, the color will be applied automatically. In addition, shapes and text are 100% editable
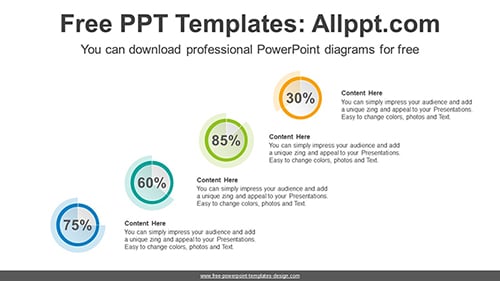
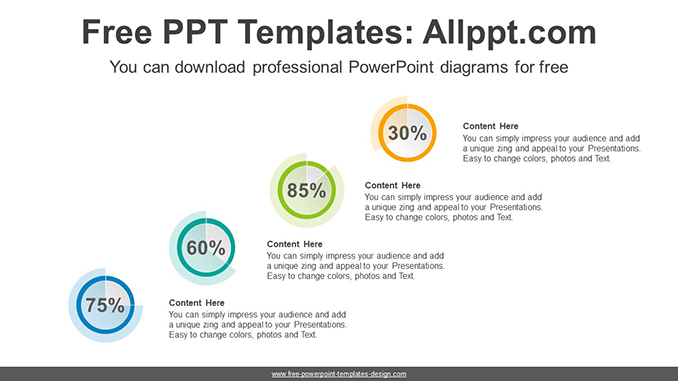
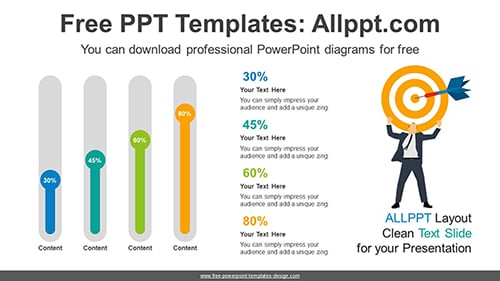
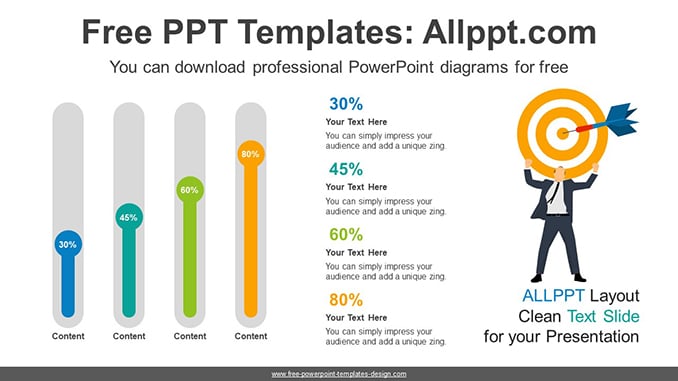
This ‘Target Bar Chart PowerPoint Diagram’ Preview:
This template can be used for school classes, business purposes, and commercial purposes. However, this template cannot be distributed absolutely.
You May Also Like